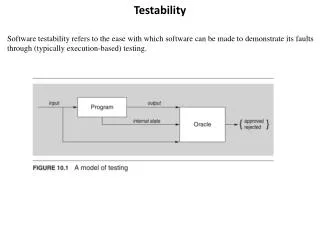
RTL Testability Analyzer
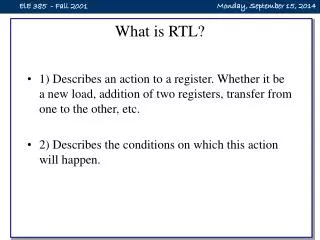
RTL Testability Analyzer. Speaker: Yen-An Chen Advisor: Chun-Yao Wang 07/03/2009. Outline. Introduction Flow chart THLF structure Calculate Critical Vector at non-logic gate Global testability indicator Controllability computation Discussion Future work. Introduction.


RTL Testability Analyzer
E N D
Presentation Transcript
RTL Testability Analyzer Speaker: Yen-An Chen Advisor: Chun-Yao Wang 07/03/2009
Outline • Introduction • Flow chart • THLF structure • Calculate Critical Vector at non-logic gate • Global testability indicator • Controllability computation • Discussion • Future work
Introduction • We want to estimate testability at RTL level instead of calculating testability at gate level, so that we can eliminate the time of synthesis. • We want to use high-level-like synthesis to do the simulation instead of simulating gate-level netlist. • Fault detection probability: to show the difficulty to simultaneously set a value to a node from the PIs and observe the node in the POs.
Flow Chart RTL behavior Read RTL behavioral code first. After using heigh-level-like synthesis, we got THLF. And then we use Monte Carlo method on THLF netlist to do the simulation. Finally, we can get the testability of statements in each blocks. High-level-like Synthesis Levelizer THLF • Levelizer includes: • Levelize • Manipulate OR gates Monte Carlo Testability Report
THLF structure Data part Decision point Control unit
Calculate Critical Vector at non-logic gate Trace back trough non-logic gate Cri-1 = 1111 0111 Cri = 1000 + 1110 Cri-1 = 1111 0111 Non-logic has no effect on critical vector, Critical vector is always be 1 !
Global testability indicator Circuit: PO • From “An Improved Register- • Transfer Level Functional • Partitioning Approach for • Testability” PI ‧ ‧ ‧ ‧ ‧ PI PO Global testability indicator =
Examples • Example 1 • How to collect the block of fault detective probability? RTL Behavior: THLF: module test2(A, B, con, D, E); input A, B, con; output D, E; wire A, B, con; reg C, E, D; always @ (A or B or con) begin C = A; if(con) D = C; else D = B; E = B; end endmodule 1 2 3 4
Monte Carlo (Simulation): (0.5+0.5)/2 = 0.5 Statement testability indicator 0.5 0.5 (0.5+0.5+0.5)/3 = 0.5 (0.5+0+0.5+0.5)/4 = 0.38 0011 0.5 0.5 0.5 0.5 0 0.5 0.5 0 0101 0111 0.5 0.5 (0.5+0+0)/3 = 0.19 (0.5+0.5+0.5)/3 = 0.5
Controllability computation Oi = Ai ⊕ Bi • From “High Level Synthesis • With Testability Constraints” Ai 0 1 Bi Bi 0 1 0 1 0 1 1 0 C1(Oi) = C0(Ai)C1(Bi) + C1(Ai)C0(Bi) C0(Oi) = C0(Ai)C0(Bi) + C1(Ai)C1(Bi) Same as simulation!
RTL Behavior: THLF: 01 • Calculate cout: • module counter(a, cout); • input [1:0]a; • output [1:0]cout; • reg [1:0]cout; • always @ (a) begin • cout = a + 1; • end • endmodule 10 10 01 We just simulate! • Example2 • How to simulate through the non-logic gates?
Discussion • The difference of testability number between THLF and synthesis when calculating non-logic gates. Synthesis: THLF: in1 gate level in1 high level out out in2 in2 We do not have module-internal lines!
“A STAFAN-like Functional Testability Measure for Register-Level” • They perform functional(module) simulation at register-level netlist on every test vectors. • They report in fault coverage of a module. • They also consider module-external lines only. • “A framework and method for hierarchical test generation” discovered: The test vectors generated for stuck-at faults on module-external lines covered most of the stuck-at faults on module-internal lines as well.
The difference of fault coverage between gate-level and high-level • The gate-level description had 1276 faults. It is clear from • the Figure that the error in estimation of fault coverage • decreases with an increase in the number of test vectors. • We may also get higher testability value than gate-level.
Future Work • Keep experimenting and thinking or finding more information.