Download
1 / 51
510 likes | 636 Vues
Inter-Temporal and Inter-Regional Analysis of Household Car and Motorcycle Ownership Behaviours in Asian Big Cities. SAKURA Project July 2004. Nobuhiro Sanko, Hiroaki Maesoba, Dilum Dissanayake Toshiyuki Yamamoto, and Takayuki Morikawa Nagoya University. INTRODUCTION. Economic Growth.

E N D
Inter-Temporal and Inter-Regional Analysis of Household Car and Motorcycle Ownership Behaviours in Asian Big Cities SAKURA Project July 2004 Nobuhiro Sanko, Hiroaki Maesoba, Dilum Dissanayake Toshiyuki Yamamoto, and Takayuki Morikawa Nagoya University
INTRODUCTION Economic Growth Income Increase Vehicle Ownership Increase
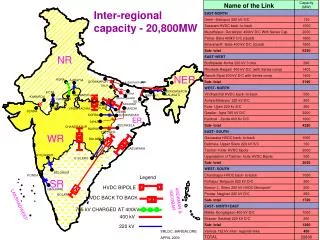
CASE STUDY CITIES We are HERE
CASE STUDY CITIES Nagoya, Japan (1981, 1991, 2001) Bangkok, Thailand (1995/96) Manila, Philippines (1996) Kuala Lumpur, Malaysia (1997)
Car Ownershipin Case Study Cities (1960 ~ 1995)
Car Ownership Forecast around the World Number of Cars Owned (100 mln units) OECD U.S.A. Others Total (Yr) Increasing Trend in Developing Courtiers
INTRODUCTION Vehicle Ownership Increase can cause traffic congestions and environmental problems Some Countermeasures Considered • Investment in road infrastructure and public transit systems • Regulations against vehicle ownership and usage • Technical innovation in vehicle performance However, understanding vehicle ownership behaviours is the key and prerequisite.
OBJECTIVES • Modelling and comparing vehicle ownership behaviours in the case study cities (Nagoya, Bangkok, Kuala Lumpur and Manila) • Obtaining insights into the effects of accessibility on vehicle ownership behaviours • Evaluating temporal and spatial transferability of vehicle ownership models
MODELLING FRAMEWORK Mode Choice Model Multinomial Logit Model (Trip Level) Vehicle Ownership Model Bivariate Ordered Probit Model (Household Level) Accessibility Measures Household members’ SE Trip makers’ SE LOS
MODELLING FRAMEWORK Comparing Vehicle Ownership Models and Evaluating their Transferability NGO81 NGO91 NGO01 BKK95 Inter-temporal comparison and temporal transferability KL97 Inter-regional comparison and spatial transferability MNL96
CASE STUDY CITIES AND THE DATA Nagoya, Japan (1981, 1991, 2001) Bangkok, Thailand (1995/96) Manila, Philippines (1996) Kuala Lumpur, Malaysia (1997)
Chukyo Metropolitan Area (Nagoya and Surrounding Areas) 1991 Area:5656, 5173, 6696km2 Population:7.8, 8.1, 9.0million (1981, 1991, 2001) (1981, 1991, 2001)
Bangkok Metropolitan Region (BMR) Nakorn Pathom Pathumthani Nonthaburi BMA Samut Sakorn Samut Prakarn N Area: 7758 km2 Population: 13 million Data Source: UTDM survey in 1995/96.
Kuala Lumpur Metropolitan (KLMP) Klang Vally 500 km2 Area: 500 km2 Population: 4.1 million 243 km2 Data source: JICA survey in 1997.
Metro Manila Area: 636 km2 Population: 14.4 million Data source: JICA survey in 1996.
Vehicle Ownership Characteristics in Case Study Cities NGO01 NGO91 NGO81 MC MC MC Car Car Car 90% BKK95 KL97 MNL96 MC MC Car MC Car Car In NGO, household without car (-) and with 2+ cars (+)
LOS DATA Survey area is divided into zones Travel time: Average travel time reported by respondents (if no trip is made, larger zones are considered) Cost: Not available in all case study cities, thus not included in the model SOCIO-ECONOMIC DATA Driving license holding: Difficult to forecast and highly endogenous, thus not included in the model
MODELLING FRAMEWORK Mode Choice Model Multinomial Logit Model (Trip Level) Vehicle Ownership Model Bivariate Ordered Probit Model (Household Level) Accessibility Measures Household members’ SE Trip makers’ SE LOS
Estimation Results (Summary statistics) • 15,000 samples are drawn randomly in NGO and MNL • Goodness of fit indexes are satisfactory
Estimation Results (alternative-specific constants and LOS) *Not significant at 5% level • Four alternatives except for KL (Rail, Bus, Car, MotorCycle) • Travel time is negatively estimated (not significant in KL)
Estimation Results (SE: Socio-Economic variables) *Not significant at 5% level • Three SE variables have effects on car and motorcycle usage • Male and age ≥ 20 (+) • In City (-), not significant in BKK • Three SE variables have effects on transit usage • Age ≥ 65 (+, bus) • Female (-, rail) • Student (+, in NGO; -, in BKK and MNL, rail)
MODELLING FRAMEWORK Mode Choice Model Multinomial Logit Model (Trip Level) Vehicle Ownership Model Bivariate Ordered Probit Model (Household Level) Accessibility Measures Household members’ SE Trip makers’ SE LOS
ACCESSIBILITY For individual residing in zone ( 1, …, ) Systematic component of the utility when individual uses rail and bus from zone to zone 1 respectively Zone 1 … Zone Zone Z Accessibility to Transit (Convenience of transit for those reside in zone )
ACCESSIBILITY For individual residing in zone ( 1, …, ) Zone 1 … Zone Zone Z Additional Accessibility of Car and Motorcycle Availability (Convenience of car and motorcycle if the individual can use these alternatives in addition to transit which is usually available to all citizens)
ACCESSIBILITY A potential drawback of “accessibility to transit” and “Additional accessibility of car and motorcycle availability” When the survey area is large, considering accessibility to all zones is questionable Weighted accessibility measures based on # of trips are considered.
ACCESSIBILITY For individual residing in zone ( 1, …, ) Zone 1 … Zone Zone Z Traffic volume from zone to zone by rail and bus respectively : importance of zone z for those reside in zone Weighted Accessibility to Transit
ACCESSIBILITY For individual residing in zone ( 1, …, ) Zone 1 … Zone Zone Z Weighted Additional Accessibility of Car and Motorcycle Availability
ACCESSIBILITY A potential drawback of weighted accessibility If people may travel to close and convenient zones only, then inconvenient but attractive zones may be excluded from the evaluation Anyway, we expect that the lower accessibility to transit and higher additional accessibility lead to car and motorcycle ownership intentions Accessibility measures considered (Not available due to the lack of zoning information) Manila is excluded since the model has not been estimated successfully.
MODELLING FRAMEWORK Mode Choice Model Multinomial Logit Model (Trip Level) Vehicle Ownership Model Bivariate Ordered Probit Model (Household Level) Accessibility Measures Household members’ SE Trip makers’ SE LOS
VEHICLE OWNERSHIP MODEL Propensity for Motorcycle Ownership 0 Propensity for Car Ownership 1 1 0 2 3+ 2+ Relationships these propensity functions with observations if if if if … … if if : observed # of car and motorcycle owned by household i : unknown parameter and threshold vectors to be estimated : error components standard bivariate normally distributed with correlation to be estimated , , , ,
VEHICLE OWNERSHIP MODEL Cars : 0, 1, 2 and 3+ MC’s : 0, 1 and 2+ MC Car 0 1 1 0 2 3+ 2+
EXPLANATORY VARIABLES USED Correlation Interaction Household members’ characteristics Accessibility License info. is not used: difficult to forecast in developing countries
CORRELATION AND INTERACTION <Chi-square test: with/ without correlation models> χ21(.05)=3.84 <Chi-square test: with/ without interaction models> χ21(.05)=3.84 • We have confirmed that generally: • Including error correlation significantly improves model fits • Including interaction terms does not significantly improve model fits Models with error correlation (not interaction) are presented hereafter
ESTIMATION RESULTS Accessibility measures considered ( based on L(0) and L(c) is reported) Not available As an example, the results using weighted additional accessibility of car and motorcycle availability are presented (the best fit to the data except for NGO 01 )
Estimation Results (summary statistics) • 1,000 samples are drawn randomly
Estimation Results (car ownership) • Generally, household with more members has more cars • # of workers have significant positive effects except for BKK • Males aged 20-65 have greater effects than females aged 20-65 in developing countries and used to have in NGO • Aged between 20-65 have greater effects than aged -19,66- except for NGO81 females and BKK females
Estimation Results (motorcycle ownership) • Household members’ characteristics estimated positively significantly or insignificantly except for females in KL • More members, more motorcycles, generally • # of workers have positive effects • Males have greater effects • Aged between 20-29 have greater effects than aged -19,30- except for females in NGO01 and females in KL
Estimation Results (accessibility measures) • WAAC estimated positively and significantly in NGO and BKK • WAAMC estimated positively and significantly in BKK and used to be in NGO • WAAC is estimated more significantly than WAAMC in NGO, suggesting that some own motorcycles for pleasure
Estimation Results (correlation) • Positively estimated in NGO • Positive unobserved interaction between car and motorcycle ownership • Those who intend to own cars intend to own motorcycles, and vice versa • Tend to become insignificant, that is, independent • Negatively and significantly estimated in BKK and KL • Negative unobserved interaction between car and motorcycle ownership • Those who intend to own cars DO NOT intend to own motorcycles, and vice versa (substitution effect)
TEMPORAL TRANSFERABILITY NGO81 NGO91 NGO01 NGO01 vehicle ownership is predicted using NGO81 and NGO91 models
TEMPORAL TRANSFERABILITY (Forecast value – Actual value) is presented Without weights With weights Transit Addition Transit Addition NGO81(A) NGO81(W-T) NGO81(T) NGO81(W-A) 48.6% 28.6% 51.5% 36.6% NGO91(A) NGO91(T) NGO91(W-A) NGO91(W-T) 14.8% 7.9% 15.6% 10.5% 91, without weights, additional is the best
SPATIAL TRANSFERABILITY NGO81 NGO01 BKK95 BKK95 vehicle ownership is predicted using NGO81, NGO01 and KL97 models KL97
SPATIAL TRANSFERABILITY (Forecast value – Actual value) is presented Transit NGO01(W-T) NGO81(W-T) KL(W-T) 99.0% 175.3% 50.1% Addition NGO01(W-A) KL(W-A) NGO81(W-A) 42.8% 148.3% 41.9% NGO81 and KL additional are better
CONCLUSIONS • This study analysed car and motorcycle ownership behaviours in Asian cities incorporating accessibility measures obtained through mode choice models. • Findings from the bivariate ordered probit models • More members, more vehicles • More workers, more vehicles • Males generally have greater effects on vehicle ownership • Aged between 20-65 (car) and 20-29 (motorcycle) have greater effects on vehicle ownership • Accessibility generally has significant impacts on vehicle ownership and has greater effects on car ownership • Correlation is estimated positively in NGO and negatively in developing countries