Download

1 / 18
180 likes | 320 Vues
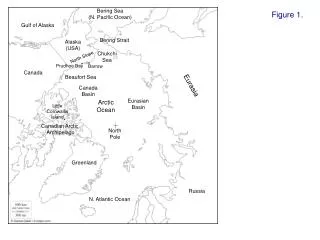
Optimization of mooring observations in the Arctic Ocean. G. Panteleev, International Arctic Research Center, UAF M. Yaremchuk, Naval Research Laboratory, Stennis Space Center D. Nechaev, Department of Marine Science, USM T.Kikuchi, Jamstec, Japan

E N D
Optimization of mooring observations in the Arctic Ocean G. Panteleev, International Arctic Research Center, UAF M. Yaremchuk, Naval Research Laboratory, Stennis Space Center D. Nechaev, Department of Marine Science, USM T.Kikuchi,Jamstec, Japan O.Francis, International Arctic Research Center, UAF 2010 Ocean Sciences Meeting. Oregon 26 February 2010 8:45 AM - 9:00 AM
Motivation and goals • The AO Science Board has set the goal of creating the integrated Arctic Observing System (iAOOS). • The development of an optimized Integrative Data Assimilation for the Arctic System (IDAAS) has been recommended by SEARCH in 2005. • A network designed for permanent hindcasting and forecasting of the AO circulation should be guided by an objective strategy. A prerequisite for developing such a strategy is the ability to answer the following questions: - How many observations do we need to calculate reliable estimates of important quantities (IQs) such as transport of Pacific water through particular sections, heat/salt content in certain basins, etc.? - How do observations in one region (e.g. velocity observations at particular sites in the Chukchi Sea) correlate with IQs in another region (e.g. vorticity in the Beaufort Gyre)? • In what regions do we need improved coverage and what are the observational accuracy requirements?
Objectives: To develop an integrated set of procedures that may facilitate: (1) Assessment of the efficiency of the existing observational programs in the Arctic Ocean. (2) Investigation how current and upcoming observational projects can improve hindcasting and forecasting of climate changes in the AO. (3) Analysis of the efficiency of High Frequency Radar (HFR) observations for operational hindcasting/forecasting of the coastal circulations.
Approaches: adjoint sensitivity analysis Data Interpolation (parameters) Map/quantities: U,V fields, transports,... 4Dvar data assimilation : Initial conditions, boundary condition for the model Data What kind of data cause the major changes in the “map”?
Approaches: adjoint sensitivity analysis 1)The 4dVar data assimilation procedure transforms a priori probability distribution for the data by injecting dynamical information, and establishes the dynamically-constrained correlations between any functions L(y) of the ocean state variables y described by the model operator M. 2) In the framework of Gaussian statistics, aposteriori probability density is described by the inverse covariance H=∂2J/∂c2. Therefore, covariance between two quantities q1, q2, expressed in terms of the control variables c as q1= L1 y= L 1Mc, q2 = L 2X= L 2Mc, iscov(q1, q2)= L 1MH -1MTL 2T. 3) The magnitude S of cov(q1, q2) can be used to estimate sensitivity of a target quantity (say, q2) to an observation of q1 in the presence of other data and dynamical constraints, which define the structure of H. We investigate sensitivity of the optimized value of q2 to observations of q1 (i.e. the derivative [δq2/ δq1 ]) under the assumption that the prior error variances σ of the control variables are much smaller than the combined observational and model error variances: S=|δq2/δq1| =|WL1TMVMTL2T|. Important: to have optimized model solution.
Approaches: OSSE(Observing Systems Simulation Experiments) • Ocean OSSEs consist of controlled, quantitative assessments of the value/impact of system of observations, determined through numerical ocean models of the governing dynamical processes. Typical OSSEs include four major steps: • identifying or generating an appropriate “Nature Run” (assumed truth); • computing synthetic observations and errors from the Nature Run; • (assimilating the simulated observations into a model • evaluating the added value of the assimilated observations in terms of increased analysis and forecast skill and other metrics.
Optimization of the mooring observations in the Bering Strait:Adjoint sensitivity analysis: Optimized surface velocity and stream function The adjoint sensitivity map of the Bering Strait transport to velocity observations reveals regions of high correlation between the velocity data and total transport through the Bering Strait.
Optimization of the mooring observations in the Bering Strait.OSSE (twin data experiment): errbst= .017, erruv=0.17 errbst= .05, erruv=0.17 errbst= .014, erruv=0.51 Errors in reconstruction of the Northern Bering Sea circulation as a function of mooring locations. The least errors are obtained with moorings placed at the optimal locations revealed by the adjoint sensitivity analysis.
Optimization of the mooring observations in the Bering Strait.Adjoint sensitivity analysis of the optimized circulation in 1990-1991
Optimization of the mooring observations in the Bering Strait.Adjoint sensitivity analysis of the optimized circulation in 1990-1991: Adjoint Sensitivity: d(BSTr)/dV(x,y) Velocity across A3 section 2007-2009 field studies in From 1990-1991 observations: Correlation ( VA3,BST ) = 0.88 Correlation ( VA2,BST ) = 0.94
Optimization of the High-Frequency Radar observations Siberia Alaska Schematic showing desired coastal HFR observations in the Bering Strait region (Calder et al., 2009)
Optimization of the HFR observations Adjoint sensitivity analysis: Adjoint sensitivity of the integral surface circulation with respect to HFR observations in the eastern Chukchi Sea. The “score” is estimated as squared sensitivity of the surface velocity with respect to small changes in the “observed” surface velocity field. 1 Alaska Alaska 3 2 Alaska Alaska 4
Optimization of the HRF (radar) observations OSSE approach: “True” err 0.26 err 0.38 err 0.76
Optimization of the HRF (radar) observations OSSE: OSSE approach: “True” err 0.12 2 HFRs
Optimization of velocity observations in the AO Alaska Russia Russia Optimized mean surface velocities for 1900-2006 (result of reanalysis of the Arctic Ocean circulation
Alaska Mean =397 Alaska Alaska Mean =26 Mean =553 Correlation between the integral circulation in the upper 300 m and transport observations at isolated moorings and a hydrophysical section Control vector = initial conditions
Correlation between the integral circulation in the upper 300 m and transport observations at isolated moorings. Control vector = boundary conditions
Summary Preliminary adjoint sensitivity experiments indicate that: - a number of locations of primary dynamical importance do exist in the Northern Bering Sea. These locations are optimal for mooring deployment in the sense of the reconstruction of the circulation and the Bering Strait transport - if the Bering Strait transport is monitored with only one mooring, the best placement is in the US EZ in the Strait. - the preference location of an HF radar in the Kotsebu Bay is at Kivalina. Two HFRs (in Kivalina and Shishmaref) provide a considerable improvement of the circulation reconstruction - In the open AO, a North Pole mooring constrains transport through the Canadian Archipelago, whereas moorings in the Beaufort Gyre control the flow through both the Canadian and the Chuckchi Sea regions.