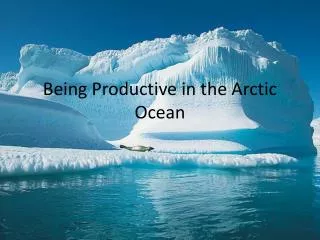
Arctic Ocean
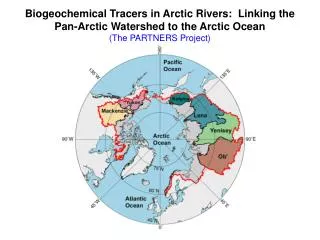
Bering Sea (N. Pacific Ocean). Figure 1. Gulf of Alaska. Bering Strait. Alaska (USA). Chukchi Sea. North Slope. •. •. Prudhoe Bay. Barrow. Canada. Beaufort Sea. Eurasia. Canada Basin. Eurasian Basin. Arctic Ocean. Little Cornwallis Island. •. Canadian Arctic Archipelago.

Arctic Ocean
E N D
Presentation Transcript
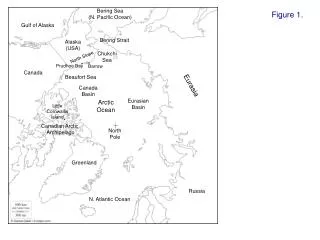
Bering Sea (N. Pacific Ocean) Figure 1. Gulf of Alaska Bering Strait Alaska (USA) Chukchi Sea North Slope • • Prudhoe Bay Barrow Canada Beaufort Sea Eurasia Canada Basin Eurasian Basin Arctic Ocean Little Cornwallis Island • Canadian Arctic Archipelago North Pole Greenland Russia N. Atlantic Ocean
Figure 2. Min. ice extent, 5 Sept. 1980 a. 3,410,000 km2 1980 (7.52M km2) (45% of 1980) b. c. 2007 (4.13M km2) 2012 (3.41M km2) Min. ice extent, 16 Sept. 2012
Figure 5. Greenland anomaly relative to the mean of 2002-2012 Alaska and Canada anomalies relative to the mean of 2003-2012
Figure 6. Median (blue line) and mean (yellow line) ±1 standard deviation of 86 ensemble members of 36 CMIP5 models Observed average September minimum ice extentfrom NSIDC (National Snow and Ice Data Center)