Resolution= Resolving Power
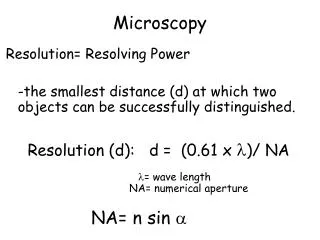
Microscopy. Resolution= Resolving Power -the smallest distance (d) at which two objects can be successfully distinguished. Resolution (d): d = (0.61 x )/ NA = wave length NA= numerical aperture. NA= n sin . Microscopy. Resolution= Resolving Power

Resolution= Resolving Power
E N D
Presentation Transcript
Microscopy • Resolution= Resolving Power • -the smallest distance (d) at which two objects can be successfully distinguished. • Resolution (d): d = (0.61 x )/ NA • = wave length • NA= numerical aperture NA= n sin
Microscopy • Resolution= Resolving Power • -the smallest distance (d) at which two objects can be successfully distinguished. • Resolution (d): d = (0.61 x )/ NA • = wave length n = refractive index of medium • NA= numerical aperture = ½ of angular aperture NA= n sin
NA= n sin Refractive index (η) of different media Air=1.0003 Water=1.33 Immersion Oil=1.515
Resolution versus Wavelength Resolution: d= 0.61 x NA Wavelength (nanometers) Resolution (micrometers) 360 .19 400 .21 450 .24 500 .26 550 .29 600 .32 650 .34 700 .37
Resolving Distance (d) Human eye 0.2 mm Light Microscope 0.2 um Scanning Electron Microscope 2.5 nm Transmission Electron Microscope 1.0 nm Resolution: d= (0.61 x )/ NA HistoTip: Avoid confusion when discussing resolution. Increased resolution or resolving power usually means a SMALLER value of d (distance).
PROBLEM: Objective lens A: Magnification = 40X N.A. = 0.45 Objective lens B: Magnification = 40X N.A. = 0.80 -->Which objective lens would give the sharper image and why?
PROBLEM: You photograph some liquid crystalline DNA using objective D and objective E. You then enlarge the images to the same size using Photoshop in the manner described below. Image D : 20X objective, NA= 0.40, enlarged 10X Image E : 4X objective, NA= 0.10, enlarged 50X Which image would be sharper and why?
HistoTip: Maximum useful magnification=1000 X N.A. Empty Magnification: an image is enlarged, but no additional detail is resolved. A : 20X objective, NA= 0.40, enlarged 10X. Magnified 200 B : 4X objective, NA= 0.10, enlarged 50X. Magnified 200
HistoTip: Maximum useful magnification=1000 X N.A. Empty Magnification: an image is enlarged, but no additional detail is resolved. A : 20X objective, NA= 0.40, enlarged 10X. Max Mag=400 B : 4X objective, NA= 0.10, enlarged 50X. Max Mag=100
Image of specimen: • made of points appearing as Airy patterns with center disk. • result of light diffracted as it passes through specimen. • size influenced by NA: NAa<NAb<NAc http://www.microscopy.fsu.edu/primer/anatomy/numaperture.html
Resolution determined by overlap of Airy disks. http://www.microscopy.fsu.edu/primer/anatomy/numaperture.html
“Criterion for resolution: the central ring in the diffraction pattern of one image should fall on the first dark interval between the Airy disk of the other and its first diffraction ring.”
Point sources of light appear as Airy diffraction patterns (disks) in the microscope. http://www.microscopyu.com/articles/formulas/formulasresolution.html
Compound microscope • Optical Components • - Light source • Diaphragm • Condenser • Lenses • objectives • - oculars Nikon E200
Condenser Aperture Setting and Image Quality Contrast increases as less light passes through condenser (a) 90% (b) 60 % (c) 20%
Microscopy: Phase contrast • - excellent for living tissue: unstained specimens with little • contrast • utilizes differences in refractive index or thickness to • create contrast (manipulation of phase of light) Living Cells in Brightfield Living Cells in Phase Contrast
Organelles have different refractive indexes but appear invisible in bright field microscopy. Light is refracted & slowed by objects proportional to their refractive index & thickness. A phase plate allows barely refracted light to pass undisturbed while highly refracted light passes is slowed further (1/4 wavelength). Organelles with higher refractive indices appear darker in phase contrast microscopy. http://www.ruf.rice.edu/~bioslabs/methods/microscopy/phase.html
Phase Contrast Microscopy: Phase plate and annulus Alignment required Objective Condenser http://microscopy.berkeley.edu/Resources/instruction/images/phase_contrast_img_0.jpg
Differential Interference Contrast (DIC) (aka Nomarski) - shows phase differences in the specimen in a relief-like fashion. Phase contrast DIC
Differential Interference Contrast (DIC) DIC Phase Contrast Epithelial cell Kidney tubule Stem
Fluorescence Microscopy • Fluorescent molecule = fluorochrome • - absorbs light of specific wavelength • - when excited by absorption, the • fluorochrome emits light of longer • wavelength • Every fluorochrome has an absorption and emission spectra.
Fluorescence Microscopy Fluorochrome Structurally unstable when excited
EXCITATION SPECTRA Frequency of Event EMISSION SPECTRA Fluorochrome DAPI FITC Rhodamine Frequency of Event WAVELENGTH
Fluorescence Microscopy • Components: • Light source • Excitation filter • Emission filter • Dichroic mirror • -reflects short • -passes long SPECIMEN EYE PIECE
Frog Neuromuscular Junction Texas Red-Acetylated TUBULIN FITC ACTIN By Stephanie Moeckel-Cole
BrainBow Labeled neurons in brain with different combination of fluorochromes. Fluorchromes: DiO, DiI, DiD Gan WB, Grutzendler J, Wong WT, Wong RO, Lichtman JW.
FLUORESCENCE MICROSCOPY • PROBLEM: Photobleaching (fading) • Photobeaching: Fluorochrome loses ability to fluoresce, absorb and emit light, due to damage or covalent modification. http://microscopyu.com/articles/fluorescence/fluorescenceintro.html
Fluorochrome PHOTOBLEACHING
(a-f) Images collected at 2 minute intervals. http://microscopyu.com/articles/fluorescence/fluorescenceintro.html
Quantum Dots : semiconductor nanoparticles, such as cadmium selenide, that emitted light after light excitation. • Advantages: brighter, no photobleaching, broad excitation • Disadvantages: potential toxicity for in vivo imaging Alivisatos et al.; Quantum dots as cellular probes.; Annu Rev Biomed Eng. 2005;7:55-76.