AP STATS
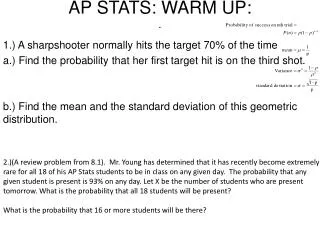
AP STATS. Linear Regression Classwork Answers. Classwork Answers (1-5). R 2 = 48.2% Differences in fares explain 48.2% of the variability in distance. b 1 = .0786 b 0 = 177.21 fare-hat = 177.21 + 0.0786 (distance). Classwork Answers (6-10).

AP STATS
E N D
Presentation Transcript
AP STATS Linear Regression Classwork Answers
Classwork Answers (1-5) • R2 = 48.2% • Differences in fares explain 48.2% of the variability in distance. • b1 = .0786 • b0 = 177.21 • fare-hat = 177.21 + 0.0786 (distance)
Classwork Answers (6-10) • The predicted fare for a 200-mile flight is $192.93 • The predicted fare for a 2000-mile flight is $334.41. • I will explain… • The fare is $177.21 when the distance is zero. This is the “base” fare. • For each additional mile flown, the fare increases by $0.0786.
Classwork Answers (11-13) • The residual is the “actual fare” minus the “predicted fare”. The actual fare is $212 and the predicted fare (y-hat) is $312.32. The residual is $-100.32. • A positive residual means that the actual fare is more than the predicted fare. • A negative residual means that the actual fare is less than the predicted fare.