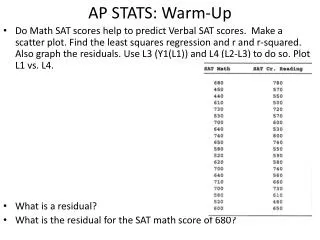
AP Stats Final Project
By Josh Spiezle, Emy Chinen , Emily Lopez, Reid Beloff. AP Stats Final Project. Our Question…. Do peanut M&M’s have the same % of color proportions as milk chocolate M&M’s?. Why did we choose this as our final project…?.

AP Stats Final Project
E N D
Presentation Transcript
By Josh Spiezle, EmyChinen, Emily Lopez, Reid Beloff AP Stats Final Project
Our Question… • Do peanut M&M’s have the same % of color proportions as milk chocolate M&M’s?
Why did we choose this as our final project…? • Well, we chose this as our final project because our group has Em and Em in it, and we all LOVE chocolate. Clearly, this made the most sense!
What will be the target population…? • Milk Chocolate M&M’s and Peanut M&M’s
Planned Sample Size… • 56 ounces of each kind!
Where and how will you collect our data…? • We will be counting out each color in the bag then divide by the total number of M&M’s in the bag.
Our hypotheses: • Ho: The proportions of colors in peanut M&M’s matches the proportions of the milk chocolateM&M colors. • Ha: At least one of the color proportions between the 2 types of M&M’s are not equal.
Our Conditions: • 1.) Randomness – bags of each type of M&M’s chosen randomly
Our Conditions: 2.)Expected values are greater than 5
Our Conditions: 3.) Independence Since we are sampling without replacement, must check 10% condition. Np = 10np » Np= 10(1743) » Np = 17430 NR= 10nR » NR = 10(1777) » NR = 17770 Safe to assume at least 17,430 peanut M&M’s and 17,770 milk chocolate M&M’s in entire population so 10% condition is met.
The test we shall perform… X²-Homogeneity test! df = (r-1)(c-1) = (6-1)(2-1) = 5 X² cdf (313.3018, 1000, 5) X² -value large # df P-value = 1.38131x 10^-65
Type I and Type II errors, which one is worse…? • Type I-Statistical test rejects that proportions of colors are equal when they are. • Type II-Statistical test fails to rejectthem being equal when they are not. • We believe that neither error type is worse in this situation so we will be leaving our alpha level at 0.05.
Our Conclusion: • Our Chi-Squared Test of Homogeneitygivesa p-value of 1.382 x 10^-65 which is significantly less than any reasonable alpha level. Thus we are able to reject our null hypothesis and conclude there is enough evidence to say that the proportion of the colors in peanut M&M’s and milk chocolate M&Ms are not equal.
Actual Percentages • Plain Variety: • 30% brown • 20% yellow • 20% red • 10% green • 10% orange • 10% blue • Peanut Variety: • 20% brown • 20% yellow • 10% red • 10% green • 10% orange • 30% blue