Download
1 / 20
200 likes | 366 Vues
This educational resource explains the concept of z-scores and measures of position used in statistical analysis. It defines how z-scores are calculated, illustrating their application in evaluating a data point's position relative to the mean. Examples include the analysis of car speeds and monthly utility bills, demonstrating how z-scores can identify unusual values within a normal distribution. The resource also covers quartiles, the five-number summary, and box-and-whisker plots, providing a comprehensive overview of data distribution patterns, central tendencies, and spread. ###

E N D
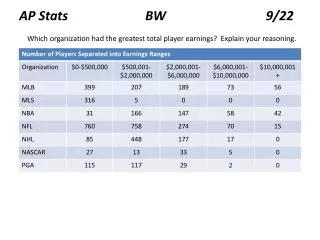
Which organization had the greatest total player earnings? Explain your reasoning. AP Stats BW 9/22
Identify and analyze patterns of distributions using shape, center and spread. Section2.5 – Measures of Position SWBAT: Source: www.wilsonmar.com
Standard Deviation is used to measure spread associated with mean When you know the mean AND standard deviation of a data set, you can measure a specific data value’s position in the data set with a standard score, or z-score. Negative z-score: the x-value is below the mean Positive z-score: the x-value is above the mean Z = 0: the x-value is equal to the mean Measures of Position
The z-score represents the number of standard deviations a given value x falls from the mean μ. Standard Score….. aka….. Z-Score Very unusual scores Unusual scores Usual scores
The mean speed of vehicles along a stretch of highway is 56 miles per hour with a standard deviation of 4 miles per hour. You measure the speed of 3 cars as 62 mph, 47 mph and 56 mph. Find the z-score corresponding to each speed. What can you conclude? Z-Score - example 1st car: x = 62; z= 1.5 2nd car: x = 47; z = -2.25 3rd car: x = 56; z = 0 If the distribution of the speeds is approximately normal, the car traveling 47 miles per hour is traveling unusually slowly because its speed has a z-score of -2.25.
2) The montly utility bills in a city have a mean of $70 and a standard deviation of $8. Find the z-scores for bills of $60, $71, and $92. What can you conclude? Z-Score - example x = 60; : z= -1.25 x = 71; z = 0.125 x = 92; z = 2.75 If the distribution of the bills is bell-shaped, then the $92 bill is unusually high as it’s standard z-score is 2.75 standard deviations above the mean.
The z-table will tell you what percentile the z-score falls into. Using our z-scores from the phone bills, look up percentile Z-Score – Table 4: Standard Normal Distribution z= -1.25 0.1056 10.6th percentile z = 0.125 between 0.5478 & 0.5517 55th percentile z = 2.75 0.9970 98th percentile
The 5-number summary is used to measure position associated with the median Fractiles are numbers that partition, or divide, an ordered data set into equal parts: Measures of Position: 5-number summary >95% or <5% unuSually high/low
Interpret the following ogives: What test score represents the 72nd percentile? Interpret. Interpreting Percentiles The 72nd percentile corresponds to a test score of 1700. This means that 72% of students had an SAT score of 1700 or less.
At what percentile is a team that scores 40 touchdowns? Interpreting Percentiles, cont’d 40 corresponds to the 50th percentile which means that 50% of the teams scored 40 or fewer touchdowns.
Divide an ordered data set into four approximately equal parts • Q1 (1st Quartile or lower quartile): ≈ ¼ of the data fall on or below the 1st quartile • Q2 (2nd Quartile or median): ≈ ½ of the data fall on or below the 2nd quartile • Q3 (3RD Quartile or upper quartile): ≈ ¾ of the data fall on or below the 3rd quartile • IQR (Interquartile range): the difference between the 3rd and 1st quartiles • Used to analyze the variation of the middle 50% of the data. • Also used to identify outliers. • IQR = Q3 – Q1 • Q3 + 1.5(IQR) outlier Q3 + 3(IQR) extreme outlier • Q1 – 1.5(IQR) outlier Q1 – 3(IQR) extreme outlier QUARTILES
Finding Quartiles MANUALLY • The test scores of 15 employees enrolled in a CPR training course are listed. • 13, 9, 18, 15, 14, 21, 7, 10, 11, 20, 5, 18, 37, 16, 17 • STEPS: • ORDER DATA • Find Q2 (Median) • Find Q1(Median of the lower half of the data) • Find Q3 (Median of the upper half of the data) • Calculate IQR • Calculate possible outlier values QUARTILES - Example
The test scores of 15 employees enrolled in a CPR training course are listed. • 13, 9, 18, 15, 14, 21, 7, 10, 11, 20, 5, 18, 37, 16, 17 • 5 7 9 10 11 13 14 15 16 17 18 18 20 21 37 QUARTILES - Example lower half upper half Q1 = 10 Q2 (median) = 15 Q3 = 18 IQR (18 – 10) = 8 Outliers - none: (18 + 1.5(8)) = 45 or (10 – 1.5(8)) = -17 Extreme outliers – none Q2 Q3 Q1
Quartiles lead to FIVE-NUMBER SUMMARY • Minimum entry • First Quartile • Median • Third Quartile • Maximum entry • The graphical representation of the 5-# summary is a box-and-whisker plot QUARTILES, cont’d
The test scores of 15 employees enrolled in a CPR training course • 7 9 10 11 13 14 15 16 17 18 18 20 21 37 • Min: 5 Q1 = 10 Q2 (median) = 15 Q3 = 18 Max: 37 BOX-AND-WHISKERS PLOT, example About half the scores lie between 10 and 18. Given the length of the right whisker, 37 might be an outlier.
BOX-AND-WHISKERS PLOT, interpreting Lowest wage is $22 and highest is $30 per day. The median wage is $25. 50% of the wages are between $23.80 and $27. The data is skewed right. Lowest score was 54%, highest was 98%. The median score was 79%, with the middle 50% of scores between 66% and 90%. The data is skewed left.
BOX-AND-WHISKERS PLOT, interpreting Data set: 10, 12, 14, 18, 22, 23, 24
1) Tuition costs (in thousands of dollars) for 25 liberal arts colleges are listed. 23, 25, 30, 23, 20, 22, 21, 15, 25, 24, 30, 25, 30, 20, 23, 29, 20, 19, 22, 23, 29, 23, 28, 22, 28 Tuition costs (in thousands of dollars) for 25 universities. 20, 26, 28, 25, 31, 14, 23, 15, 12, 26, 29, 24, 31, 19, 31, 17, 15, 17, 20, 31, 32, 16, 21, 22, 28 BOX-AND-WHISKERS PLOT – use Calculator!
P 109. 3-10, 13, 15, 25, 27, 33, 35 HOMEWORK: