Download
1 / 12
120 likes | 246 Vues
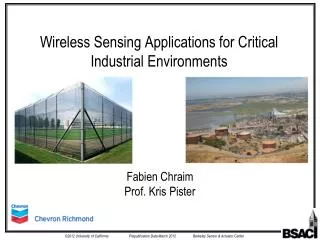
Wireless Sensing Applications for Critical Industrial Environments. Fabien Chraim Prof. Kris Pister. Richmond Refinery Wireless Umbrella. Smart Fence – Proposed System Architecture. 50uA / 20mA 10uA / 1 mA 10uA / 2mA. Sequential Hypothesis Testing.

E N D
Wireless Sensing Applications for Critical Industrial Environments Fabien ChraimProf. Kris Pister
Smart Fence – Proposed System Architecture 50uA / 20mA 10uA / 1 mA 10uA / 2mA
Sequential Hypothesis Testing • Used in radar, clinical trials, channel selection… • Decision making as samples are collected • Two hypotheses • H0: no (or low) activity • H1: high activity H1 transmitted No transmission 0 660ms 0 660ms 0 210ms H0 transmitted [1] A.Wald and J.Wolfowitz, “Optimum character of the sequential probability ratio test,” Ann. Math. Statist., vol. 19, pp. 326339, 1948. [2] Fellouris, G.; Moustakides, G.V.; , “Decentralized Sequential Hypothesis Testing Using Asynchronous Communication,” Information Theory, IEEE Transactions on , vol.57, no.1, pp.534-548, Jan. 2011
Sequential Hypothesis Testing – Example Outputs 0 8 seconds 0 1.6 seconds
Smart Fence - Continuation • Solar energy scavenging • Enclosure redesign • Air quality monitoring (H2S)
Valve Position Monitoring • Why? • Detect abnormalities (alarms) • Better understanding of pressure gradients (plant-wide) • Goals • Instrument a variety of valves (ball, butterfly, gate, globe) • Report position wirelessly • Accuracy of +/- 5 degrees (or 5%) • No calibration / Easy installation • Lifetime of ~5 years • Cheap
Project Outlook • Large fence deployment (Intrusion + gas sensing) • On-site valve testing • Motor Vibration sensing (pumps, small electric motors…)