Download
1 / 76
760 likes | 1.61k Vues
James C. Gibeaut Tiffany Hepner, Bill White, Becky Smyth, Tom Tremblay John Andrews, Roberto Gutierrez, Rachel Waldinger Bureau of Economic Geology Jackson School of Geosciences The University of Texas at Austin

E N D
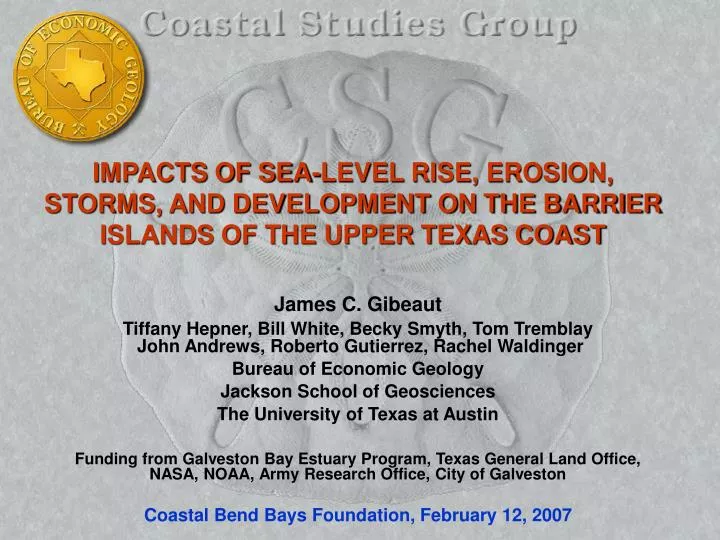
James C. Gibeaut Tiffany Hepner, Bill White, Becky Smyth, Tom Tremblay John Andrews, Roberto Gutierrez, Rachel Waldinger Bureau of Economic Geology Jackson School of Geosciences The University of Texas at Austin Funding from Galveston Bay Estuary Program, Texas General Land Office,NASA, NOAA, Army Research Office, City of Galveston Coastal Bend Bays Foundation, February 12, 2007 IMPACTS OF SEA-LEVEL RISE, EROSION, STORMS, AND DEVELOPMENT ON THE BARRIER ISLANDS OF THE UPPER TEXAS COAST
Data generalized from various sources. Diagram modified from Fisher, W. L., Brown, L. F., Jr., McGowen, J. H., and Groat, C. G., 1979.
today ~4m 5,300 yr BP Barrier Island Formation
today ~4m 5,300 yr BP Barrier Island Formation
Pier 21 - Galveston 180.0 160.0 140.0 120.0 100.0 Average water level (cm) y = 0.652x - 1145.6 Global ocean-level rise 80.0 2 R = 0.9436 60.0 4.36 + 2.16 = 6.52 mm/yr 40.0 20.0 Local land subsidence 0.0 1900 1910 1920 1930 1940 1950 1960 1970 1980 1990 2000 2010 Year Relative Sea-Level Change
Barrier Island Cross Section Protective Ridge Bay Gulf Wetland Upland Island Core Upland Wetland Upland Beach/ Dune Future Wetland After 60 Years of Sea-Level Rise and Erosion Protective Ridge Wetland Island Core Beach/ Dune Upland Wetland Upland Today Future Beach/Dune
Gulf Of Mexico Shoreline Change Statistics • 11,708 measurement locations spaced 50 m alongshore = 585.4 km of shoreline length • 2 to 10 shorelines at each transect but 80% of transects had 5 or more shorelines • Stable = 173.6 km, 29.6% • Advancing = 46.3 km, 7.9%, mean = 5.4 m/yr • Retreating = 365.6 km, 62.4%, mean = -2.6 m/yr
-2 m/yr SHORELINE CHANGE RATE FREQUENCY Retreat Advance
Sabine Pass Galveston Bay Bolivar Roads Matagorda Bay Colorado River Pass Cavallo Corpus Christi Bay Aransas Pass Baffin Bay Brazos Santiago Pass High (>2m/yr) retreat rates = red
Sabine Pass Galveston Bay Bolivar Roads Matagorda Bay Colorado River Pass Cavallo Corpus Christi Bay Aransas Pass Baffin Bay Brazos Santiago Pass High (>2m/yr) retreat rates = redModerate retreat rates (0.61 to 2 m/yr) = orange
Sabine Pass Galveston Bay Bolivar Roads Matagorda Bay Colorado River Pass Cavallo Corpus Christi Bay Aransas Pass Baffin Bay Brazos Santiago Pass High (>2m/yr) retreat rates = redModerate retreat rates (0.61 to 2 m/yr) = orangeStable rates (<0.61 m/yr) = blue
Galveston Island State Park, Pre-Frances, August 8, 1998 (profile BEG-02)
Galveston Island State Park, Post-Frances, September 16, 1998 (profile BEG-02)
Galveston Island State Park, April 27, 2006 (profile BEG-02)
1961 Post Hurricane Carla
1961 – post Carla Jamaica Beach Galveston Isl.
2002 Jamaica Beach Galveston Isl.
Modeled Water Level Water Level (m) Wind Direction & Relative Speed Measured at offshore buoy #42035 ADCIRC hydrodynamic model University of North Carolina 9/22 21:00
Modeled Water Level Water Level (m) ADCIRC hydrodynamic model University of North Carolina 9/23 03:00
Modeled Water Level Water Level (m) ADCIRC hydrodynamic model University of North Carolina 9/23 15:00
Modeled Water Level Water Level (m) ADCIRC hydrodynamic model University of North Carolina 9/23 21:00
Modeled Water Level Water Level (m) ADCIRC hydrodynamic model University of North Carolina 9/24 03:00
Modeled Water Level Water Level (m) ADCIRC hydrodynamic model University of North Carolina 9/24 09:00
Modeled Water Level Water Level (m) ADCIRC hydrodynamic model University of North Carolina 9/24 15:00
Modeled Water Level Water Level (m) ADCIRC hydrodynamic model University of North Carolina 9/24 21:00
LA Calcasieu Pass TX Rita Landfall Sabine Pass Rollover Pass
Galveston Island State Park Area H. Rita Erosion/ Deposition