Download
1 / 1
10 likes | 84 Vues
Advances in Breeding for Winter Hardiness in Oats P. V. Maloney 1 , J. H. Lyerly 1 , D. R. Wooten 1 , J. M. Anderson 3 , D. P. Livingston III 2 , G. Brown-Guedira 2 , D. Marshall 2 , and J. P. Murphy 1 1 North Carolina State University, 2 USDA-ARS, Raleigh, 3 USDA-ARS, West Lafayette.

E N D
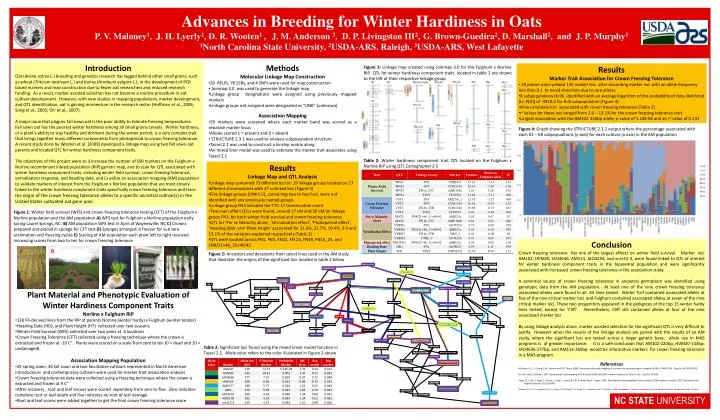
Advances in Breeding for Winter Hardiness in Oats P. V. Maloney1, J. H. Lyerly1, D. R. Wooten1 , J. M. Anderson 3, D. P. Livingston III2,G. Brown-Guedira2, D. Marshall2, and J. P. Murphy11North Carolina State University, 2USDA-ARS, Raleigh, 3USDA-ARS, West Lafayette Introduction Oat (Avena sativa L.) breeding and genetics research has lagged behind other small grains, such as wheat (Triticum aestivum L.) and barley (Hordeum vulgare L.), in the development of PCR based markers and map construction due to fewer oat researchers and reduced research funding. As a result, marker assisted selection has not become a routine procedure in oat cultivar development. However, with new studies in mapping populations, marker development, and QTL identification, oat is gaining momentum in the research sector (Hoffman et al., 2006, Song et al., 2005; Orr et al., 2007). A major issue that plagues fall sown oat is the poor ability to tolerate freezing temperatures. Fall sown oat has the poorest winter hardiness among all small grains cereals. Winter hardiness, or a plant’s ability to stay healthy and dormant during the winter period, is a very complex trait that brings together many different components from photoperiod to crown freezing tolerance. A recent study done by Wooten et al. (2009) developed a linkage map using two fall sown oat parents and located QTL for winter hardiness component traits. The objectives of this project were to i) increase the number of SSR markers on the Fulghum x Norline recombinant inbred population (RIP) genetic map, and to scan for QTL associated with winter hardiness component traits, including winter field survival, crown freezing tolerance, vernalization response, and heading date, and ii) utilize an association mapping (AM) population to validate markers of interest from the Fulghum x Norline population that are most closely linked to the winter hardiness component traits specifically crown freezing tolerance and trace the origin of the crown freezing tolerance alleles to a specific ancestral cultivar(s) in the United States cultivated oat gene pool. • Methods • Molecular Linkage Map Construction • 20 RFLPs, 76 SSRs, and 4 SNPs were used for map construction • Joinmap 3.0 was used to generate the linkage map • Linkage group designations were assigned using previously mapped markers • Linkage groups not assigned were designated as “UNK” (unknown) • Association Mapping • 29 markers were screened where each marker band was scored as a separate marker locus • Alleles scored 1 = present and 0 = absent • STRUCTURE 2.3.1 was used to analysis subpopulation structure • Tassel 2.1 was used to construct a kinship matrix along • An mixed liner model was used to estimate the marker trait associates using Tassel 2.1 Figure 3: Linkage map created using Joinmap 3.0 for the Fulghum x Norline RIP. QTL for winter hardiness component traits located in table 2 are shown to the left of their respective linkage group • Results • Marker Trait Association for Crown Freezing Tolerance • 29 primer pairs yielded 135 marker loci after discarding marker loci with an allele frequency less than 0.1 to avoid distortion due to rare alleles • 8 subpopulations (K=8) identified with an average logarithm of the probability of data likelihood (Ln P(D)) of -3910.4 for K=8 subpopulation (Figure 4) • Nine candidate loci associated with crown freezing tolerance (Table 2) • r2 values for these loci ranged from 2.6 – 13.1% for the crown freezing tolerance trait • Largest association with the AM102-220bp allele, p-value of 5.13E-04 and an r2 value of 0.131 Figure 4: Graph showing the STRUCTURE 2.3.1 output where the percentage associated with each K1 – K8 subpopualtions (y-axis) for each cultivar (x-axis) in the AM population Table 2: Winter hardiness component trait QTL located on the Fulghum x Norline RIP using QTL Cartographer 2.5 • Results • Linkage Map and QTL Analysis • Linkage map contained 73 different loci on 19 linkage groups located on 17 different chromosomes with 37 unlinked loci (Figure 3) • Five linkage groups (UNK1-5), containing two to four loci, were not identified with any previously named groups • Linkage group FN3 included the T7C-17 translocation event • Two main effect QTLs were found, around 17 cM and 30 cM on linkage group FN3, for both winter field survival and crown freezing tolerance • QTL for ‘Per se Maturity alone’, ‘Vernalization effect’, ‘Photoperiod effect’, ‘Heading date’ and ‘Plant height’ accounted for 11.6%, 21.7%, 10.4%, 3.9 and 13.1% of the variation explained respectively (Table 2) • QTL were located across FN1, FN3, FN22, FN 24, FN49, FN16_23, and FN9/21+46_31+40/42 Conclusion Crown freezing tolerance has one of the largest effects on winter field survival. Marker loci AM102, HVM20, JAO4636, AM114, JAO4234, and xncs15-3, were found linked to QTL of interest for winter hardiness component traits in the biparental population and were significantly associated with increased crown freezing tolerance in the association study. A potential source of crown freezing tolerance in ancestral germplasm was identified using genotypic data from the AM population. At least one of the nine crown freezing tolerance associated alleles were found in all 63 lines tested. Winter Turf contained associated alleles at five of the nine critical marker loci and Fulghum contained associated alleles at seven of the nine critical marker loci. These two progenitors appeared in the pedigrees of the top 15 winter hardy lines tested, except for ‘Cliff’. Nevertheless, Cliff still contained alleles at four of the nine associated marker loci By using linkage analysis alone, marker assisted selection for the significant QTL is very difficult to justify. However when the results of the linkage analysis are paired with the results of an AM study, where the significant loci are tested across a larger genetic base, allele use in MAS programs is of greater importance. It is a safe conclusion that AM102-220bp, HVM20-143bp, JAO4636-277bp, and AM114-260bp would be informative markers for crown freezing tolerance in a MAS program. Figure 2: Ancestors and decedents from select lines used in the AM study that illustrate the origins of the significant loci located in table 2 below • Plant Material and Phenotypic Evaluation of Winter Hardiness Component Traits • Norline x Fulghum RIP • 128 F6-derived lines from the RIP of parents Norline (winter hardy) x Fulghum (winter tender) • Heading Date (HD), and Plant Height (HT) collected over two seasons • Winter Field Survival (WFS) collected over two years at 3 locations • Crown Freezing Tolerance (CFT) collected using a freezing technique where the crown is extracted and frozen at -10 C°. Plants were scored on a scale from zero to ten (0 = dead and 10 = undamaged). • Association Mapping Population • 25 spring sown, 36 fall sown and two facultative cultivars represented in North American introductions and contemporary cultivars were used for marker trait association analysis • Crown freezing tolerance data were collected using a freezing technique where the crown is extracted and frozen at 9 C° • After recovery , root and leaf tissues were scored separately from zero to five. Zero indicates complete root or leaf death and five indicates no root of leaf damage • Root and leaf scores were added together to get the final crown freezing tolerance score Figure 1: Winter field survival (WFS) and crown freezing tolerance testing (CFT) of the Fulghum x Norline population and the AM population A) WFS test for Fulghum x Norline population early spring Laurel Springs, NC. B) AM population WFS test in April at Waynesville, NC C) Crowns prepared and placed in sponge for CFT test D) Sponges arranged in freezer for sub zero acclimation and freezing cycles E) Scoring of AM population each plant left to right received increasing scores from two to ten for crown freezing tolerance Table 2: Significant loci found using the mixed linear model function in Tassel 2.1. Allele color refers to the color illustrated in Figure 2 above References Hoffman, D.L., J. Chong, E.W. Jackson and D.E. Obert. 2006. Characterization and mapping of a crown rust resistance gene complex (Pc58) in TAM O-301. Crop Sci. 46:2630-2635. Orr, W. and S.J. Molnar. 2007. Development and mapping of PCR-based SCAR and CAPS markers linked to oil QTLs in oat. Crop Sci. 47:848. Song, Q., J. Shi, S. Singh, E. Fickus, J. Costa, J. Lewis, B. Gill, R. Ward and P. Cregan. 2005. Development and mapping of microsatellite (SSR) markers in wheat. TAG Theoretical and Applied Genetics 110:550-560. Wooten, D. R., D. P. Livingston, III, H. J. Lyerly, J. B. Holland, E. N. Jellen, D. S. Marshall, and J. P. Murphy. 2009. Quantitative Trait Loci and Epistasis for Oat Winter Hardiness Component Traits. In Press. A B C D E NC STATE UNIVERSITY