Download
1 / 21
210 likes | 415 Vues
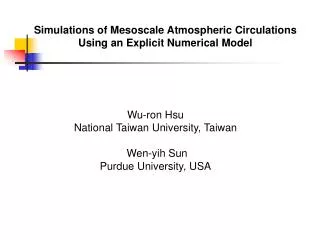
Simulations of Mesoscale Atmospheric Circulations Using an Explicit Numerical Model. Wu-ron Hsu National Taiwan University, Taiwan Wen-yih Sun Purdue University, USA. NTU/Purdue Nonhydrostatic Numerical Model Mesoscale Meteorology Boundary-layer Meterology Land-sea Breezes Mountain Waves

E N D
Simulations of Mesoscale Atmospheric Circulations Using an Explicit Numerical Model • Wu-ron Hsu • National Taiwan University, Taiwan • Wen-yih Sun • Purdue University, USA
NTU/Purdue Nonhydrostatic Numerical Model Mesoscale Meteorology Boundary-layer Meterology Land-sea Breezes Mountain Waves Local Circulations in Taiwan Large Eddy Simulation in a Heterogeneous Environment Squall Line Simulation Basic Geofluid Dynamics
NTU/Purdue Nonhydrostatic Model (Hsu and Sun 2001) Finite difference method Fully compressible Explicit forward-backward integration for both high-frequency waves and gravity waves No computational mode in time Time split scheme for high-frequency waves, gravity waves, diffusion, and surface processes. Suitable for parallel computation
NTU/Purdue Nonhydrostatic Numerical Model Basic dynamic framework 1.5th order Turbulence scheme Semi-Lagrangian advection scheme Cloud physics Land processes Surface-layer processes
Parallel Computation z y i-1 ii+1 × × × … CPU1 CPU2 CPU3 x
Model source codes are written in the MPI protocol with the help from NCHC. The model has been tested on both IBM Power 4 machines and PC clusters. The efficiency for parallel computation depends on the number of grid points in a simulation, the number of CPU used in a job, the distribution of clouds in numerical results. The efficiency can reach over 95% for a 128-processor job.
The model is evaluated with a linear mountain wave simulation. The simulated streamlines match closely with the analytical solution provided by Queney (1948). Streamlines obtained from analytic solution (solid lines) and by numerical simulation (after 10 h). We have multiplied the magnitudes of model perturbations by 100 for comparison. As such they constitute a linear solution for a 1 km high mountain.
Bubble Simulation • A thermal bubble with a radius of 200 m is released in a neutral environment. • Total number of grid points used in this simulation is 164 x 164 x 180 points with resolution of 10 m. • Two animations show surfaces of constant potential temperature perturbation of 0.06 K and 0.22 K, respectively.
SL Vertical Profile of Potential Temperature T = 53 min
A large eddy simulation of cloud streets and cellular convections during cold air outbreak events • A very cold air mass moves over a warm ocean surface. Stratocumulus develops. Convections take many forms; sometimes as 2-D rolls and sometimes as 3-D cells. • Total number of grid points used in this simulation is 400 x 140 x 70 points with resolution of 200 m x 100 m x 50 m. • The animation show surfaces of constant mixing ratio of 0.1 g of liquid water per 1 kg of dry air.
Jan Mayen (71N,10W) (Atkinson, 1996)
Open cell Closed cell
(K) 290 14 km 110 km 90 km 7 km 70 km 50 km 0 283
( K ) Z=50m y (km) x (km)
Local atmospheric circulations in Taiwan during winters • Stratocumulus evaporated over the lee side of the Central Mountain Range as the strong northeasterly monsoon encounters Taiwan during winters. • Total number of grid points used in this simulation is 252 x 252 x 80 points with resolution of 2.5 km x 2.5 km x 300 m. • The following figures show satellite observation and simulated cloud distribution. • Different colors are used to show clouds at different height levels.
Clouds evaporated in the lee side of CMR Trapped waves
Conclusions The NTU/Purdue Nonhydrostatic Model has produced promising results for simulations of atmospheric mesoscale circulations. High-resolution simulations of atmospheric circulations are very demanding in terms of computer resources. Breakthroughs in computer technology will lead to enhancement of our knowledge, particularly, in atmospheric sciences.