Understanding Sampling Techniques in Statistics
Learn various sampling techniques and determine the validity of samples in statistical analysis. Identify biased and unbiased samples. Practice identifying and describing samples in real-world scenarios.

Understanding Sampling Techniques in Statistics
E N D
Presentation Transcript
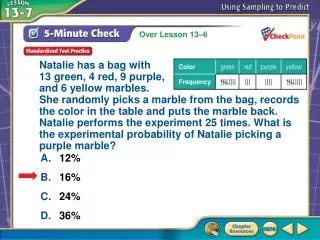
A B C D Natalie has a bag with 13 green, 4 red, 9 purple, and 6 yellow marbles. She randomly picks a marble from the bag, records the color in the table and puts the marble back. Natalie performs the experiment 25 times. What is the experimental probability of Natalie picking a purple marble? A. 12% B. 16% C. 24% D. 36% 5-Minute Check 5
You have already analyzed data. (Lessons 13–1 through 13–5) • Identify various sampling techniques. • Determine the validity of a sample. Then/Now
sample A subgroup or subset of a population used to represent the whole population • population • unbiased sample • biased sample A large group used in statistical analysis A random sample that is representative of a larger sample A sample that is not representative of a population (leaves out representation of the population) Vocabulary
Identify and Describe Samples A hardware store wants feedback on their products and service. The store includes a telephone number on each receipt so customers can call and participate in a survey. Identify the sample as biased or unbiased and describe its type. Explain your reasoning. Answer: This is a biased sample. The sample is a voluntary response sample since it includes only those customers who choose to participate. Example 1
A B C D To determine the leading candidate for governor, all of the registered voters in one district are called and asked who they favor. Is the sample biased or unbiased? Describe its type. A.unbiased; simple random sample B.unbiased; systematic random sample C.biased; convenience sample D.biased; voluntary response sample Example 1 CYP
Using Sampling to Predict VACATION Mr. Stevens surveyed every tenth student in the hallway to see where they would prefer to go on vacation. Forty-eight percent preferred the beach, 36% preferred an amusement park, and 16% preferred the mountains. Is this sampling method valid? If so, how many of the 560 students in the school would you expect to say they preferred the beach? Explain. This is a systematic random sample. 48% of 560 = 0.48 ● 560 or about 269 Answer: So, about 269 students preferred the beach. Example 2
A B C D A. COLORS To determine favorite colors, students wearing either blue or red were surveyed. 32% preferred blue, 29% preferred red, 23% preferred yellow, and 16% preferred green. Is this sampling method valid? If so, out of 450 students in the entire school, how many would you expect to say they prefer red? A. yes; 144 students B. yes; 29 students C. yes; 131 students D. no; invalid sample Example 2 CYP
Using Sampling to Predict MUSIC A middle school planned to play music during lunch. To determine what type of music students preferred, 25 students with MP3 players in one lunch period were surveyed and asked what type of music they preferred. Sixteen said they preferred country music. Is this sampling method valid? If so, find how many of the 535 students in school you can expect to prefer country music. Explain. Answer: No; this is a biased, convenience sample since only students with MP3 players in one lunch period were surveyed. So, this sampling method will not produce a valid prediction. Example 3
A B C D Adrienne surveyed people in her neighborhood about their favorite candidate for mayor of her city. 45% of them preferred Alber, 35% preferred Diaz, and 30% preferred Howard. Her city has 50,000 residents. Which statement is correct? A.No conclusions can be drawn because the survey was biased. B.Diaz can expect to be supported by about 20,000 people. C.Howard can expect to be supported by about 18,000 people. D.Alber can expect to be supported by about 22,500 people. Example 3 CYP