Download
1 / 19
220 likes | 591 Vues
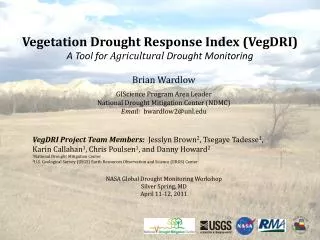
Vegetation Drought Response Index (VegDRI) A Tool for Agricultural Drought Monitoring. Brian Wardlow GIScience Program Area Leader National Drought Mitigation Center (NDMC) Email: bwardlow2@unl.edu VegDRI Project Team Members: Jesslyn Brown 2 , Tsegaye Tadesse 1 ,

E N D
Vegetation Drought Response Index (VegDRI) A Tool for Agricultural Drought Monitoring Brian Wardlow GIScience Program Area Leader National Drought Mitigation Center (NDMC) Email: bwardlow2@unl.edu VegDRI Project Team Members: Jesslyn Brown2, Tsegaye Tadesse1, Karin Callahan1, Chris Poulsen1, and Danny Howard2 1National Drought Mitigation Center 2U.S. Geological Survey (USGS) Earth Resources Observation and Science (EROS) Center NASA Global Drought Monitoring Workshop Silver Spring, MD April 11-12, 2011
Traditional Vegetation Indices (VIs) Many VIs have been developed to monitor vegetation conditions using various spectral band combinations (visible red and near, middle, and thermal infrared). • Normalized Difference Vegetation Index (NDVI) - Vegetation Condition Index (VCI) • Enhanced Vegetation Index (EVI) - Temperature Condition Index (TCI) • Normalized Difference Water Index (NDWI) - Vegetation Health Index (VHI) • Wide Dynamic Range Vegetation Index (WDRVI) • Advantages: • Straightforward calculations based • on remotely sensed multi-spectral • data. • Demonstrated relationships with • biophysical characteristics of • vegetation. • Challenges: • Discriminating drought-impacted areas • from locations experiencing other • types of stress (pests, disease, flooding, • and fire) or land cover change. • Classifying the different levels of • drought severity (e.g., moderate, • severe, and extreme).
What is VegDRI? VegDRI is a new ‘hybrid’ drought index that integrates: - satellite-based observations of vegetation conditions - climate-based drought index data - biophysical characteristics of the environment to produce 1-km spatial resolution maps that depict ‘drought-related’ vegetation stress.
Goals of VegDRI 1. Classify relative drought severity on vegetation using a modified Palmer Drought Severity Index classification scheme.
Goals of VegDRI VegDRI June 29, 2009 USDM June 30, 2009 2. Operational tool with national-level monitoring capabilities that provides local-scale information (i.e., county to sub-county level) regarding the level of drought stress on vegetation.
VegDRI – A Hybrid-Based Approach Remote Sensing Component Climate Component Biophysical Component Role: Environmental characteristics that influence climate-vegetation interactions. Inputs: 1) land use/cover type 2) soil characteristics 3) elevation 4) ecological setting 5) irrigated ag. land Role: Spatial detailed information about vegetation patterns and conditions acquired from satellite-based NDVI data. Inputs: 1) Percent Annual Seasonal Greenness (PASG) 2) Start of Season Anomaly (SOSA) Role: Coarser-scale geographic patterns of dryness. Inputs: 1) Standardized Precipitation Index (SPI) 2) self-calibrated Palmer Drought Severity Index (PDSI) + +
Regression Tree Model (*) VegDRI Methodology 1. Historical Database Development Data Input Variables Satellite Data 2. Model Development 3. Map Generation 1) Percent Annual Seasonal Greenness (PASG) 2) Start of Season Anomaly (SOSA) Climate Data 1) Palmer Drought Severity Index (PDSI) 2) Standardized Precip. Index (SPI) 1-km VegDRI Map Biophysical Data • 1) land use/ cover type • soil available water • capacity (STATSGO) • ecoregion type • irrigation status • elevation (*) Models developed from a 20-year historical record (1989 – 2008) of bi-weekly climate and AVHRR satellite observations at 2,200+ weather station locations. Biophysical variables are static over time.
Timeline of OperationalVegDRI Development • Project Facts: • 6 project staff (4 at NDMC and 2 at • USGS EROS) • Began operational production of • weekly MODIS-based VegDRI maps • over the continental United States in • summer 2010 to compliment bi- • weekly AVHRR-based VegDRI maps. • Completed 20+ year historical record • (1989 to present) of VegDRI maps for • the CONUS in fall 2010. Empirical VegDRI model results were evaluated statistically and through drought expert feedback during each expansion phase. Model parameters were adjusted and new inputs variables were incorporated over the 4-year period to produce the final VegDRI model implemented operationally in 2009.
Development of eMODIS VegDRI • eMODIS VegDRI was developed to provide a tailored product for the U.S. • Drought Monitor and capitalize on higher quality NDVI data from MODIS. • The eMODIS system (Jenkerson et al., 2010) at USGS EROS is designed to • provide a 7-day rolling NDVI composite that allows for customized NDVI • product for a specified time interval. • A pheno-region based, AVHRR-MODIS NDVI translation algorithm (Gu et al., • 2010) was used to apply the AVHRR-based VegDRI models to MODIS-derived • NDVI inputs.
AVHRR/eMODIS VegDRI Comparsion AVHRR-Based VegDRI August 09, 2010 eMODIS-Based VegDRI August 08, 2010 vs. • Both maps depict similar drought • patterns. • Majority of differences are a ‘1-class’ • difference in the VegDRI classification • scheme. • eMODIS VegDRI maps tend to less noisy • (less speckled) patterns than the • AVHRR-derived maps that can be • attributed to higher quality data and • more rigorous corrections applied • to the MODIS data. AVHRR/eMODIS VegDRI Difference Map
Assessing the Performance of VegDRI A Multi-Source, Convergence of Evidence Approach • 1. Quantitative Methods • Statistical model testing • Comparison with crop yield data and other • in situ measurements (e.g., biomass and soil moisture) • 2. Qualitative Methods • Comparison with spatial patterns in maps of other drought indices and • indicators (e.g., USDM and NWS estimated precipitation) • Establishment of a national evaluator network to collect expert feedback • about the accuracy and utility of VegDRI for drought monitoring. • - ~150 evaluators • - state climatalogists, USDM authors, other drought experts, agricultural/natural resource specialists, and agricultural producers.
20-Year Statistical Accuracy of VegDRI Models Average Correlation of 2,417 Weather Station Locations Across the CONUS 20-fold, ‘hold-out year’ cross validation (1 fold = 19 years of data to train model and 1 year of data for validation)
Assessment of Local-Scale VegDRI Drought Patterns An Example Over Wisconsin U.S. Drought Monitor (August 11, 2009) VegDRI (August 10, 2009) (*) % represent percent of historical average precipitation received at selected stations by August 2009
Evaluator Perspective of VegDRI’s Performance How accurately does the VegDRI map reflect conditions in your county or region? Very Accurate Very Inaccurate • "Cheyenne (Ch) is quickly degrading in terms of greenness (now about 2 inches below normal precipitation after being normal on April 1). Vegetation is quickly browning out." (#1) • "I just got back from a trip to Thermopolis (T) and the area from Wheatland (W) to about 30 miles west of Casper (Cs) is green and in good shape (#2), the area west of Casper (Cs) from Powder River (PR) to Thermopolis (T) is very dry - vegetation is very brown, the cheatgrass is brown, no new green growth there (#3).“ • USDA ARS Scientist; • Source: Visual Observation Sample size (n) of respondents typically ranges between 20 – 35 evaluators (10-20% participation rate) during the year.
Distribution of VegDRI Data and Products NDMC VegDRI Webpage USGS EROS Drought Viewer http://gisdata.usgs.net/website/Drought_Monitoring/viewer.php http://drought.unl.edu/vegdri/VegDRI_Main.htm NIDIS Drought Portal Map Viewer http://www.drought.gov/portal/server.pt/community/drought.gov/map_viewer
Examples of VegDRI Products Standard Suite of VegDRI Maps Animations Areal Statistics Map Highlight Narrative Change Maps
Who is Using VegDRI? Examples… New Mexico Drought Status Report U.S. Drought Monitor authors National Weather Service Drought Reports Arizona Drought Monitor Report
Current and Future Work • International Expansion • Canada – extend current VegDRI models for seamless U.S. Canada coverage for North American Drought Monitor (spring 2011) • Europe • India • Argentina (Patagonia region) • Model Enhancements with New Inputs • Thermal input – development of historical AVHRR and MODIS data set • New climate indices – Standard Precipitation Evaporation Index (SPEI) • NDVI Crosswalk Between AVHRR, MODIS, and VIIRS
Thanks for your attention! For additional information about VegDRI, please visit the VegDRI website http://drought.unl.edu/vegdri/VegDRI_Main.htm or contact Brian Wardlow National Drought Mitigation Center bwardlow2@unl.edu