Download
1 / 1
10 likes | 241 Vues
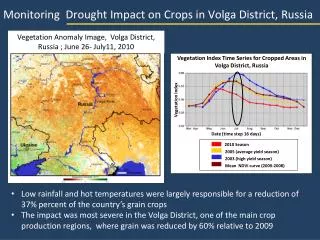
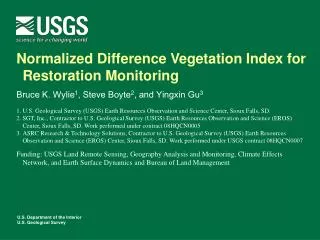
ESTIMATING RAINFALL FROM THE NORMALIZED DIFFERENCE VEGETATION INDEX USING WAVELET TRANSFORM. Christian Yarlequé 1 , Adolfo Posadas 1,2 , Roberto Quiroz 1 1 Centro Internacional de la Papa, Apartado Postal 1558, Lima 12-Perú, 2 Facultad de Ciencias Físicas, DAFI, UNMSM, Lima 1, Perú.

E N D
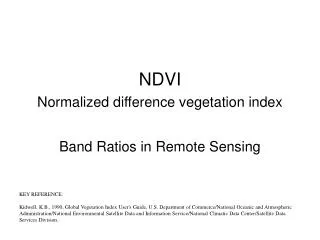
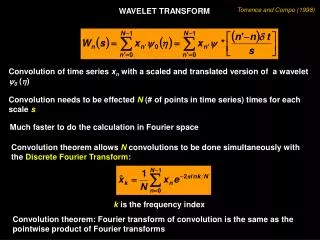
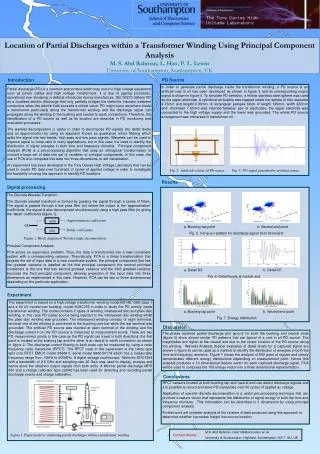
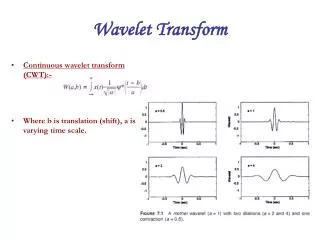
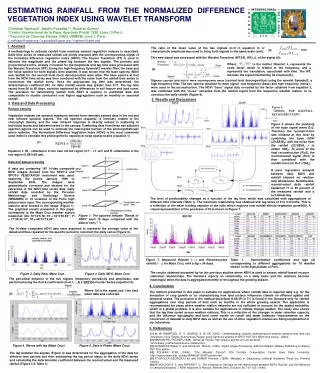
ESTIMATING RAINFALL FROM THE NORMALIZED DIFFERENCE VEGETATION INDEX USING WAVELET TRANSFORM Christian Yarlequé1, Adolfo Posadas1,2, Roberto Quiroz1 1Centro Internacional de la Papa, Apartado Postal 1558, Lima 12-Perú, 2 Facultad de Ciencias Físicas, DAFI, UNMSM, Lima 1, Perú. c.yarleque@cgiar.org / a.posadas@cgiar.org / r.quiroz@cgiar.org 1. Abstract The ratio of the mean value of the two signals (n=0 in equation 3) or characteristic amplitude was used to bring both signals to the same scale (unit). (3) A methodology to estimate rainfall from remotely sensed vegetation indexes is described. Daily time series of measured rainfall are jointly analyzed with the corresponding signal of the normalize difference vegetation index (NDVI). The Fourier Transform (FT) is used to estimate the magnitude and the phase lag between the two signals. The periodic and proportional events, already corrected for the magnitude and lag time were processed with the Wavelet Transform (WT). Using the high-frequency Symmlet2 wavelet filter, the base and the noise spectra for both signals were attained. It was shown that the base spectra (NDVI and rainfall) for the second level (D=2) decomposition were alike. The base spectra at D=2 from the NDVI time series was then combined with the noise from the rainfall time series to reconstruct the rainfall event. Once the appropriate lag time was determined, the determination coefficient (R2) for daily rainfall events was greater than 0.71. The lag time varied from 56 to 95 days, variation explained by differences in soil texture and land cover. The precision for determining rainfall from NDVI is superior to published data and comparable to studies conducted over higher aggregations such as monthly or seasonal rainfall. This new signal was processed with the Wavelet Transform (WT)[4], Wf(λ,u), of the signal f(t): Where, is the mother Wavelet; λ, represents the scale factor which is related to the frequency, and u represents the translation, associated with time. The WT, rescales the signal maintaining its structure[5]. (4) Signals (rainfall and NDVI) were decomposed twice (second level decomposition) using the wavelet Symmlet2, a high frequency filter. The two spectra obtained for each signal –low frequency (base) and high frequency (noise) – were used in the reconstruction. The NDVI “base” signal duly re-scaled by the factor obtained from equation 3, was combined with the “noise” extracted from the rainfall signal from the respective weather station, to re-construct the daily rainfall (Figure 6). 3. Results and Discussions 2. Data and Data Processing Figure 6. "MODEL FOR RAINFALL RECONSTRUCTION“. Remote sensing Vegetation indexes are spectral measures derived from remotely sensed data in the red and near infrared spectral regions. The red spectral response is inversely related to the chlorophyll density, and the near infrared response is directly related to scattering in individual leaves and between leaves in the canopy. Combining data from these two adjacent spectral regions can be used to estimate the intercepted fraction of the photosynthetically active radiation. The Normalized Difference Vegetation Index (NDVI) is the most commonly used index to estimate this photosynthetic capacity at large spatial scales (equation 1) Figure 6 shows the similarity of the base signal when D=2. Therefore the reconstruction was initiated at this level by combining the base NDVI (2[1SB}BN) with the noise from the rainfall (2{1SB}AL ) to obtain 1SBR. To arrive at the final reconstruction (R=0), the reconstructed signal (R=1) is then combined with the rainfall noise for D=1 (1SAL). A pure regression analysis between daily NDVI and rainfall showed no relation-ship whatsoever. Nonetheless, reconstructed daily rainfall explained 71 to 85 percent of the measured rainfall and a s=2.46mm/day (1) Equation 1. IR - reflectance in the near infrred region (0.7 - 1.1 um) and R -reflectance in the red region (0.58-0.68 um), Data and data processing A data set containing 197 10-day composite NDVI images derived from the SPOT-4 and SPOT-5 VEGETATION instrument was used, spanning the period January 1999 to September 2003. The images were geometrically corrected and stacked for the extraction of the NDVI time series data. Daily rainfall data recorded by the Peruvian Meteorology and Hydrology Service (SENAMHI) in 10 localities of the Puno high plateau were used. The corresponding weather stations were located in the image (Figure 1). The graphical results presented in this paper correspond to the Mazo Cruz weather station located at: X0= 70°14’5.78; Y0 = 16°3’55.36''; Yf = 17°26’42.10''; Xf = 68°51’19.04'‘. The level of predictability changed as a function of the lag time, which was calculated with aggregations at different time intervals (Table 1). The maximum relationship was obtained with lag times of 2 to 3 months. This is a reflection of the water holding capacity of the soils which explains how rainfall affects vegetation growth[6]. A visual representation of the goodness of fit is shown in Figure 7. Figure 1. The squares indicate "Bands of NDVI" each 10 days compared with the data of rain ("."). The 10-days composite NDVI data were assumed to represent the average value of the dekad and thus repeated for the specific period to construct the daily series (Figure 3). Figure 7. Measured Rainfall (----) and Reconstructed rainfall (----), for Mazo Cruz, with a lag = 56 days. Table 1. Determination coefficients and lags (d) corresponding to different aggregations for 10 weather station in the high plateau of Peru. The results obtained exceeded by far the previous studies where NDVI is used to assess rainfall based on pure statistical relationships. The literature reports no relationship on a daily basis and the relations become meaningful when the data is aggregated monthly or throughout the growing season. Figure 2. Daily Rain, Mazo Cruz. Figure 3. Daily NDVI, Mazo Cruz. The periodical behavior of the two signals (frequency, periodicity and amplitude), was performed using the first 6 coefficients (n=0,1,…,6) [1][2][3]in Fourier Series (equation 2): 4. Conclusions Where f(t) is the signal and t the time when data was collected. The method presented in this paper is suitable for applications where rainfall data is required daily e.g. for the simulation of crop growth or for characterizing how land surface influences climate on different spatial and temporal scales. The precision of the method described (0.85>R2>0.71) is found in the literature only for rainfall aggregations over long periods of time such as months or the whole growing season. The application is recommended for areas where weather station networks are not sufficient to account for the spatial variability, which is a global problem. It is also suitable for applications in climate change studies. The study also shows that the lag time varied across weather stations. This is a reflection of the changes in water retention capacity and the influence topography and land cover exerts on runoff and water balances. Improvements on the conversion of dekadal to daily NDVI data as well as the use of other vegetation indexes are being implemented in our laboratory. (2) 5. References [1] W. W. IMMERZEL, R. A. QUIROZ, S. M. DE JONG; “Understanding complex spatiotemporal weather patterns and land use interaction in the Tibetan Autonomous Region using harmonic análisis of SPOT VGT-S10 NDVI time series”. (2004) [2] MARIAN PRUTSCHER (1998), Series de Fourier, http://www.e-technik.uni-ulm.de/world /lehre/basic_mathematics/fourier/node2.php3 [3] GONZÁLES Rafael C. and Richard E. Woods, (1992), Digital Image Processing, Editorial Addison-Wesley Publishing Company INC,Firts edition. [4] POLIKAR ROBI, (1996), “The Wavelet Tutorial”, 329 Durham Computation Center Iowa State University. http://users.rowan.edu/~polikar/WAVELETS/WTtutorial.html [5] FOUFOULA-GEORGIOU Efi and KUMAR Praveen, (1994), Wavelets in Geophysics, editorial Academic Press inc, Primera edición. [6] NICHOLSON S. E. and FARRAR T. J., The influence of Soil type on the relationships between NDVI, Rainfall, and Soil Moisture in semiarid botswana. I. NDVI response to Rainfall, Remote Sens. Envirom. 50: 107-120, (1994). Figure 4. Waves with lag (Mazo Cruz) Figure 5. Data in Phase (Mazo Cruz) The lag between the signals (Figure 4) was determined for the aggregation of the data for different time periods and then subtracting the lag period (days) to the daily NDVI series and calculating the determination coefficient between the reconstructed and the measured rainfall (Figure 5 & Table 1).