Vegetation Index
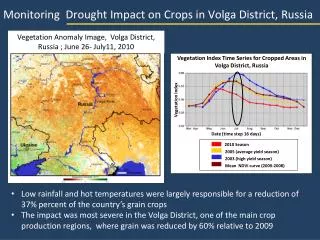
Monitoring Drought Impact on Crops in Volga District, Russia. Vegetation Index Time Series for Cropped Areas in Volga District, Russia. Vegetation Anomaly Image, Volga District, Russia ; June 26- July11, 2010. Vegetation Index. Date (time step 16 days). 2010 Season

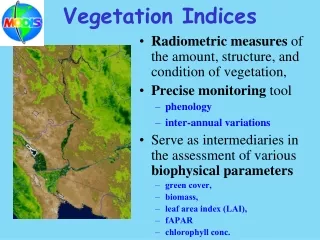
Vegetation Index
E N D
Presentation Transcript
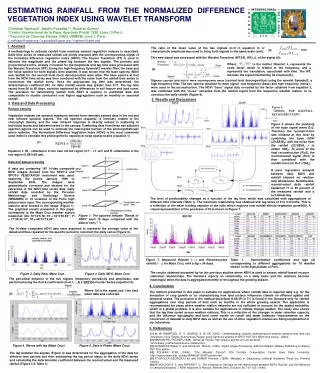
Monitoring Drought Impact on Crops in Volga District, Russia Vegetation Index Time Series for Cropped Areas in Volga District, Russia Vegetation Anomaly Image, Volga District, Russia ; June 26- July11, 2010 Vegetation Index Date (time step 16 days) 2010 Season 2005 (average yield season) 2003 (high yield season) Mean NDVI curve (2000-2008) • Low rainfall and hot temperatures were largely responsible for a reduction of 37% percent of the country’s grain crops • The impact was most severe in the Volga District, one of the main crop production regions, where grain was reduced by 60% relative to 2009
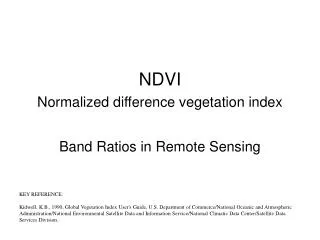
Somalia Vegetation Anomaly April 7 – May 8, 2011 NDVI Anomaly Worse than normal Better than Normal Normal NDVI Current Year (2011) NDVI Mean (2000-2010) No data
LANCE: Near Real Time NASA EOS Data Providing NASA EOS near-real-time observations to USDA FAS as well as to the GEO International Community
GLAM Near Real Time Composite Standard MODIS Composite Lag: 4-10 days Near Real Time Composite Lag: 1 day
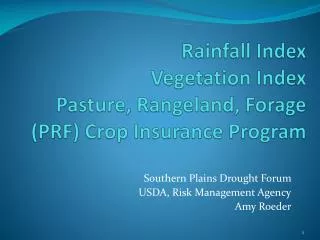
Rapid Response Daily imagery used for visual analysis by FAS Analysts for Assessing 2011 Flooding in Eastern Australia January 19, 2011 January 20, 2010 Darling River Murray, Avoca and Laddon Rivers Crop losses from flooding, physical damage from storms are projected to cause significant downgrade in quality, but minimal loss in overall volume
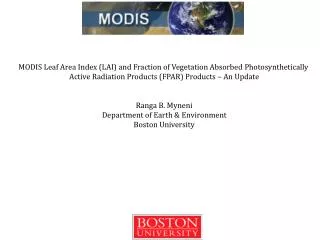
MODIS Global Crop Intensity– 250m Iowa, USA Syria Pittman, K.W., Hansen, M.C., Becker-Reshef, I., Potapov, P.V., & Justice, C.O. (2010). Estimating global cropland extent with multiyear MODIS data. Remote Sensing Journal