Download
1 / 17
170 likes | 344 Vues
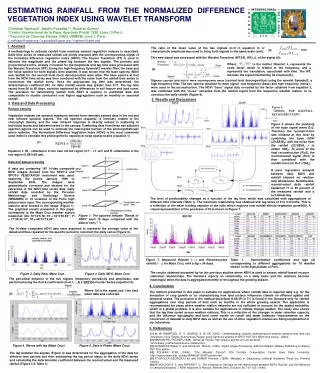
Normalized Difference Vegetation Index for Restoration Monitoring Bruce K. Wylie 1 , Steve Boyte 2 , and Yingxin Gu 3 U.S. Geological Survey (USGS) Earth Resources Observation and Science Center, Sioux Falls, SD.

E N D
Normalized Difference Vegetation Index for Restoration Monitoring Bruce K. Wylie1, Steve Boyte2, and Yingxin Gu3 U.S. Geological Survey (USGS) Earth Resources Observation and Science Center, Sioux Falls, SD. SGT, Inc., Contractor to U.S. Geological Survey (USGS) Earth Resources Observation and Science (EROS) Center, Sioux Falls, SD. Work performed under contract 08HQCN0005 ASRC Research & Technology Solutions, Contractor to U.S. Geological Survey (USGS) Earth Resources Observation and Science (EROS) Center, Sioux Falls, SD. Work performed under USGS contract 08HQCN0007 Funding: USGS Land Remote Sensing, Geography Analysis and Monitoring, Climate Effects Network, and Earth Surface Dynamics and Bureau of Land Management
Impacts of rangeland condition • Carbon sequestration and SOM preservation • Water quality, sedimentation, and erosion • Wildlife cover and sage grouse habitat • Livestock weight gains OBJECTIVES • Tracking of range condition • Past, current, future • Facilitate adaptive management & restoration
Rangeland production variability • Moisture-limited rangelands exhibit high interannual variations in productivity • Can make management effects less evident Grassland 2000-2006 variability in Net Ecosystem Exchange (Zhang et al. 2010) Vegetation variability from White et al. (2005) Relative vegetation variability 1st Quartile (minimum) 2nd Quartile 3rd Quartile 4th Quartile (maximal)
Separation of rangeland weather variation and nonweather variations • Allows for more consistent historical trend analysis in 1) weather-related variations and 2) nonweather-related variations • Management effects are de-trended from weather variations • Weather variations are de-trended frommanagement and disturbance variations
RED NIR NDVI = NIR – RED NIR + RED A proxy for rangeland productivity • Remotely sensed Normalized Difference Vegetation Index has been correlated to biomass, GPP, photosynthetic potential, and Leaf Area Index
Proxy for range productivity Growing Season NDVI (GSN) April October A: grazing B: non-grazing MODIS 250 m NDVI grazing effects B A June July
, weather) • Precipitation, maximum and minimum temperature for 3 seasons • Winter: Nov. – Feb. • Spring: March – May • Summer: June – July Soil Survey Geographic Database Productivity Index or long-term GSN , Predict GSN from weather (Expected ecosystem performance – EEP) EEP = f (site potential 2007 MODIS Growing Season NDVI (250 m) =
Piecewiseregression model to estimate rangeland performance based on weather conditions The models are developed from more than 10,000 random locations across multiple years 90 percent confidence intervals determine outliers Actual Growing Season NDVI Overperformance Normal Underperformance Weather Estimated Growing Season NDVI
Example Ecosystem Performance for Big Sagebrush in the Upper Colorado River Basin (2006) Expected ecosystem performance Real ecosystem performance Site potential Ecosystem performance anomalies
Ecosystem performance anomaly applications: Owyhee Uplands, Upper Colorado River Basin, and Platte River Basin
Performance anomaly validation with percent bare ground and stocking rates (acres/animal unit month) Regions identified as persistently underperforming tended to have a higher percentage of bare soil Regions identified as persistently overperforming tended to have a lower percentage of bare soil
Owyhee rangeland condition and trends Ecosystem performance anomaly map for 2000-2008 Trend map displays the trend at different levels of significance
Owyhee 2040 Big Sage productivity estimates(percent of current productivity) • Big Sage model applied to a near-term future climate projection • Data from National Center for Atmospheric Research (model CCSM3, moderate emission scenario-A1b)
Sagebrush 2006 performance anomalies for the northern part of the Upper Colorado River Basin • Four rangeland types were modeled and mapped but only the Big Sage is shown Overperform Normal Underperform
Platte Basin grass anomalies: implications for Switchgrass biofuel expansion Productive, good condition grasslands Crop areas which maybe more productive as grass Applied to grass areas Applied to crop areas
Upper Colorado River Basin (2005-2007) for big sage Investigating variations in the weather axis Difference between the weather-based (predict) GSN and the GSN site potential map for Big Sagebrush (2006) USGS VegDRI map (June to September) U.S. drought monitoring map (average conditions between June and September, 2006)
Summary • This study accounts for interannual weather effects on vegetation so that trend and persistence analysis are consistent • It provides land managers rangeland histories and trends • Such studies help optimize field visits and range restoration • They help put current studies into longer perspectives (historical and future)