Download
1 / 23
240 likes | 427 Vues
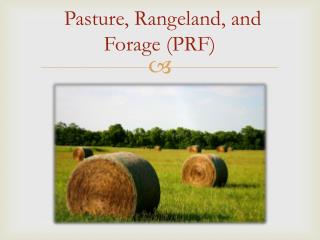
Rainfall Index Vegetation Index Pasture, Rangeland, Forage (PRF) Crop Insurance Program. Southern Plains Drought Forum USDA, Risk Management Agency Amy Roeder. Crop Insurance Goal - PRF. Rancher’s need an insurance program for their grazing and haying perils

E N D
Rainfall Index Vegetation Index Pasture, Rangeland, Forage (PRF) Crop Insurance Program Southern Plains Drought Forum USDA, Risk Management Agency Amy Roeder
Crop Insurance Goal - PRF • Rancher’s need an insurance program for their grazing and haying perils • RMA is committed to meeting those needs • Limited options • Pros and Cons to both programs (RI/VI) • Do producers prefer RI? THIS IS NOT DROUGHT INSURANCE (Multi Peril) • RMA does not use the term drought for the Vegetation Index program nor for the Rainfall Index program
Challenges – PRF • Pasture, Rangeland, Forage Crop • Various plant species • Timing of plant growth • Lack of individual/industry data • Vast range of management practices across the industry • Publicly announced prices not available • Crop continuously harvested via livestock
Program Overview Area Plan of insurance • Not individual coverage • Losses are area based, not producer based • No loss adjustments, records, etc. • More timely payments • Does not reward poor management practices
Program Overview • Index Intervals • Minimizes dependency on subjective pre-determined biomass growing seasons • Elevation, climate, etc. found within an area • Maintains consistency across the country • Allows for regional and local variance • Allows individual freedom to select appropriate intervals
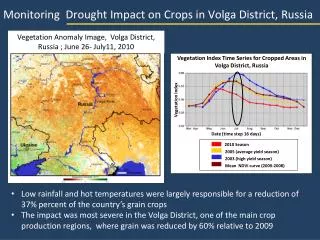
Program Overview - VI • Vegetation Index Program • Area Based Plan • Approximately 8 x 8 km grid vs. county • Utilizes satellite remote sensing data • Normalized Difference Vegetation Index (NDVI) • Deviation from Normal: 1989 to 2009, captures multiple perils • Review of historical indices and how they relate to your ranch is critical • Critical that peak of growing season is insured and not time periods outside those months
Program Overview - VI • Crop Year divided into 10, 3-month index intervals • Must select at least 1 interval • Currently can select more than 1 interval • Some areas fewer intervals are available • Ability for producers to manage appropriate timing risks • The 3-month intervals provide for greater reaction to biomass reduction events vs. a yearly average
Grid Overview – VI • Area of insurance = 8 x 8 km(~ 4.9 x 4.9 miles)
Daily Index Calculation Historical Maximum NDVIon June 1 NDVI on June 1, 2011 Daily Index for June 1= 49.7 Historical Minimum NDVIon June 1
Program Overview - RI • Rainfall Index Program • Area Based Plan • 0.25 degree grid vs. county • Utilizes NOAA daily reported weather data • NOAA: Climate Prediction Center (CPC) • Deviation from Normal: 1948 to 2009 • Review of historical indices and how they relate to your ranch is critical • Critical that critical precipitation periods are insured and not time periods outside those months
Program Overview - RI • Crop Year divided into 11, 2-month index intervals • Must select at least two intervals • Currently can select up to 6 intervals • Ability for producers to manage appropriate timing risks • The 2-month intervals provide for greater reaction to biomass reduction events vs. a yearly average • California – fewer than 11 Intervals are available
Grid Overview - RI • Area of insurance = 0.25o grids
What we hear - RI • Rancher’s believe RMA is using a single point specific weather station • Rancher’s provide NWS, NCDC, WFO, or other NOAA/USGS/NASA data sets, airport weather reports, etc. • Rancher’s use their own rain gauges • Rancher’s believe grid results will always reflect exact conditions on their ranch • Purpose: to provide general rainfall conditions in a grid, not measure a single gauge
Where we are today? • VI -Ten Index Intervals/year (3 month intervals) • Not all intervals offered in all states – less than 10 • ONLY 7 intervals have been released to date • Latest interval released to date: July, August, September • RI – Eleven Index Intervals/year (2 month intervals) • All offered in all states – exception California • ONLY 8 intervals have been released to date • Latest interval released to date: August/September • Drought conditions in New Mexico, Texas, Oklahoma, etc. with catastrophic impacts • Impacts to the industry as a whole
Amy RoederRisk Management Specialist816-926-3834amy.roeder@rma.usda.gov