Wavelet Transform Analysis for Nonstationary Hydro-Meteorological Processes
220 likes | 269 Vues
This study aims to analyze hydro-meteorological measurements and explore variations using continuous wavelet transform. Learn about transforms, Fourier transform, STFT, and applications in signal processing.

Wavelet Transform Analysis for Nonstationary Hydro-Meteorological Processes
E N D
Presentation Transcript
Wavelet Transform Analysisfor Nonstationary Rainfall-Runoff-Temperature Processes Murat KÜÇÜK, Ekrem TIGLI, and Necati AĞIRALİĞLU Istanbul Technical University ISTANBUL-TURKEY
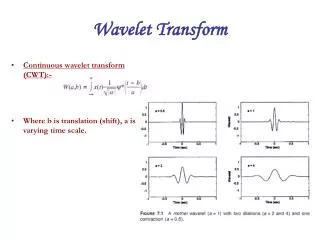
COUNTINOUS WAVELET TRANSFORM AMPLITUDE TIME SCALE main goal • In the present study, main goal is to analysis hydro-meteorological measurements such as gage height, streamflow, water temperature and precipitation measurements of a observation station in a basin; and to compare variations of each measurement with each other in time-scale domain by using continuous wavelet transform. • Transforms • Fourier transform • STFT • Continuous wavelet transform • Applications
What is a Transformand Why Do we Need One ? • Transform: A mathematical operation that takes a function or sequence and maps it into another one • Transforms are good things because… • The transform of a function may give additional /hidden information about the original function, which may not be available /obvious otherwise • The transform of an equation may be easier to solve than the original equation (recall Laplace transforms for “Def. eques”) • The transform of a function/sequence may require less storage, hence provide data compression / reduction • An operation may be easier to apply on the transformed function, rather than the original function (recall convolution)
What Does a Transform Look Like…? • Complex function representation through two components • Sinusoids as building blocks: Fourier transform • Frequency domain representation of the function discrete countinous
Some Transforms • Fourier series • Discrete Fourier transform • Laplace transform • Z-transform
Fourier transform Fourier transform decomposes a signal to complex exponential functions of different frequencies
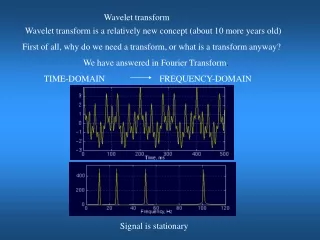
Stationary and Non-stationary Signals • Stationary signals’ spectral characteristics do not change with time • Annual mean temperature • Non-stationary signals have time varying spectra 20 Hz 50 Hz 5 Hz Concatenation
Stationary and Non-stationary Signals • Stationary signals consist of spectral components that do not change in time • all spectral components exist at all times • FT works well for stationary signals • However, non-stationary signals consists of time varying spectral components • How do we find out which spectral component appears when? • FT only provides what spectral components exist , not where in time they are located. • Need some other ways to determine time localization of spectral components • FT identifies all spectral components present in the signal, however it does not provide any information regarding the temporal (time) localization of these components.
Short Time Fourier Transform(STFT) • Choose a window function of finite length • Truncate the signal using this window • Compute the FT of the truncated signal, save. • Slide the window to the right by a small amount • Go to step 3, until window reaches the end of the signal
STFT Frequency parameter Time parameter Signal to be analyzed FT Kernel (basis function) STFT of signal x(t): Computed for each window centered at t=t’ Windowing function Windowing function centered at t=t’
The Wavelet Transform • Overcomes the resolution problem by using a variable length window • Analysis windows of different lengths are used for different frequencies: • Analysis of high frequencies Use narrower windows for better time resolution • trends, abrupt changes, floods… • Analysis of low frequencies Use wider windows for better frequency resolution • Seasonal oscillations of hydro climatic series • The function used to window the signal is called the wavelet
The Wavelet Transform A normalization constant Translation parameter, measure of time Scale parameter, measure of frequency Signal to be analyzed Continuous wavelet transform of the signal x(t) using the analysis wavelet (.) The mother wavelet. All kernels are obtained by translating (shifting) and/or scaling the mother wavelet Scale = 1/frequency
…then scale, and shift through positions High frequency (small scale) Low frequency (large scale)
Small scale -Rapidly changing details, -Like high frequency Large scale -Slowly changing details -Like low frequency Scale is (sort of) like frequency
“Johns River at Buffalo Bluff Nr Satsuma, in Florida” The station is located 29°35'46" latitude, 81°41'00" longitude in Putnam County, Florida.gage height, streamflow, water temperature and precipitation measurements of a observation station in the basinPeriod of record is between 23 June 2002 and 16 November 2003 for each measurement. Number of records, N is 512 including daily streamflow measurements, gage elevation measurements, water temperature measurements and precipitation measurements, simultaneously. Applications
Daily Data Four data sets are used in applications.
GAGE HEIGHT-STREAMFLOW 150 days period structures countinous through all time period 1 week and 15 days period structures depend on weather temperature and rainfall
180 days structures of temperature phenomena. Different from streamflow variation Structures with 30 days periods. TEMPERATURE-RINFALL
Conclusions • Analysing series can represent hydro-climatic characteristic of region at different time scale by defining periods of the hydro-climatic events by using wavelet transform • In addition, hydro-climatic characteristics of region are found with physical interpretations by using Continuous Wavelet Energy images of each measurement. • Small-scale structures such as 1 to 3 months can be easily seen in CWT image of streamflow measurements.
Conclusions • High energy density structure in the image is located about 130-150 days scale through whole time period of the measurement. • Because the gradual incensement in base flow conditions occurring in the basin during winter and early spring is responsible for the high variability at timescales of 4 months, the structure which has 130-150 days period is interpretable for streamflow measurements in this basin. • Application of the method to the precipitation measurements clearly represents small-scale structures which has variation between one week and tree weeks period, easily.