
SlideServe
Menu
Préférences
© SlideServe · v2026

Common content: Estimation

izzy avatar
54 diapositives · 719 Views · Aug 10, 2014

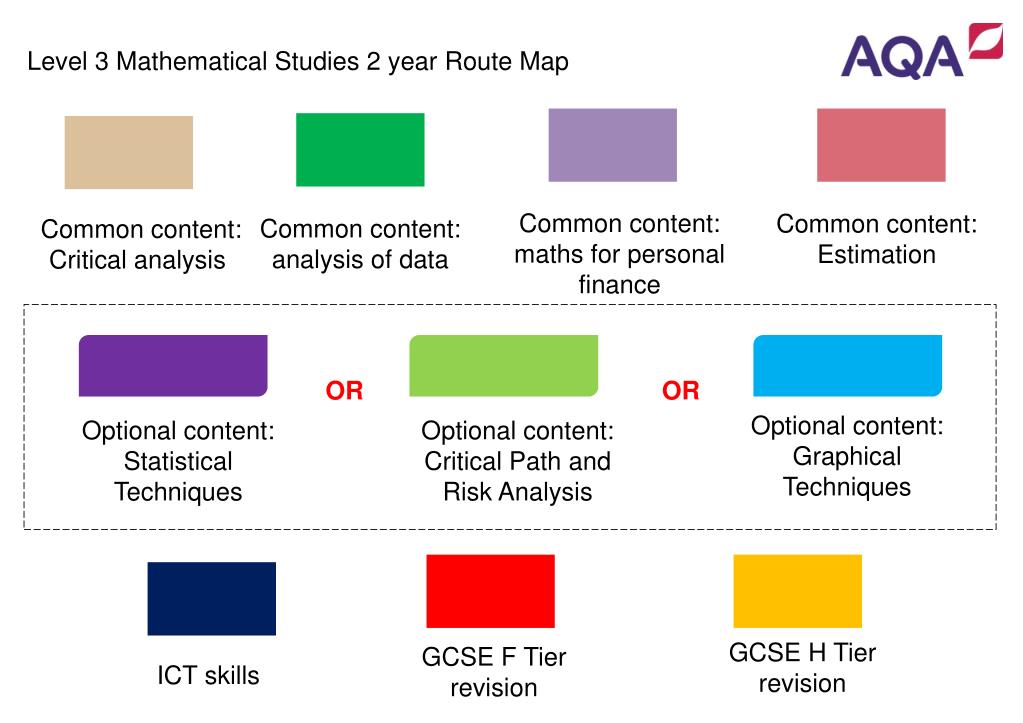
There are 3 optional topics You must chose one optional content topic to fully cover. Level 3 Mathematical Studies 2 year Route Map. Optional content: Graphical Techniques. Optional content: Statistical Techniques. Optional content: Critical Path and Risk Analysis. OR. OR.
Common content: Estimation - slide 1
01 / 54Common content: Estimation
1 / 17

Télécharger la présentation

Common content: Estimation
Une image / un lien ci-dessous est fourni (tel quel) pour télécharger la présentation

Politique de téléchargement : le contenu du site vous est fourni TEL QUEL pour votre information et votre usage personnel ; il ne peut être vendu, concédé sous licence ni partagé sur d’autres sites sans l’accord de son auteur.Le contenu vous est fourni TEL QUEL, pour votre information et votre usage personnel uniquement. Téléchargez la présentation en cliquant sur ce lien. Lors du téléchargement, si vous ne parvenez pas à télécharger une présentation, l’éditeur a peut-être supprimé le fichier de son serveur.Pendant le téléchargement, si vous ne parvenez pas à obtenir une présentation, le fichier a peut-être été supprimé par l’éditeur.

F I N

Plus de contenu associé

Transcription de la présentation
  1. There are 3 optional topics • You must chose one optional content topic to fully cover Level 3 Mathematical Studies 2 year Route Map Optional content: Graphical Techniques Optional content: Statistical Techniques Optional content: Critical Path and Risk Analysis OR OR GCSE H Tier revision GCSE F Tier revision ICT skills Common content: Critical analysis Common content: Estimation Common content: maths for personal finance Common content: analysis of data

  2. Drag your selected optional content topic 1 into the Route Map Level 3 Mathematical Studies 2 year Route Map Year 12 Holiday Percentages Introduction to spreadsheets Types of Data Collecting Data Numerical Calculations Fermi Estimation Representing data numerically 1 STATISTICAL TECHNIQUES 1 The Normal Distribution Holiday OR Interest Rates Representing data diagrammatically 1 Equation of a straight line Collecting and Sampling Data Representing data numerically 1 Holiday CRITICAL PATH AND RISK ANALYSIS 1 Critical Path Analysis Holiday Perimeter, Circumference and Area Solution to financial problems Optional content Topic 1 – (select one from the right) OR Review and recap 1 GRAPHICAL TECHNIQUES 1 Graphical Methods Holiday Holiday Holiday REVISION AND END OF YEAR EXAMS Analyse Critically 1 Similarity and Pythagoras Theorem REVISION AND END OF YEAR EXAMIANTIONS REVISION AND END OF YEAR EXAMS Surface area and similarity Project work: Analysis of Data or Personal Finance Year 13

  3. Drag your selected optional content topics 2 and 3 into the Route Map Level 3 Mathematical Studies 2 year Route Map STATISTICAL TECHNIQUES 2 Correlation and regression Year 13 Holiday AND Option Topic 2 Graphical representation Representing data diagrammatically 2 Review and recap 2 Graphical representation Representing data numerically 1 STATISTICAL TECHNIQUES 3 Probabilities and estimation Holiday Holiday OR Analyse Critically 2 Taxation: Value added tax (VAT) Review and recap 3 Optional content Topic 2 – (select one from the right) Repayments and credit CRITICAL PATH AND RISK ANALYSIS 2 Expectation AND Holiday Holiday Review and recap 4 Optional content Topic 3 – (select one from the right) Taxation: Income tax and National Insurance CRITICAL PATH AND RISK ANALYSIS 3 Cost benefit analysis Limits of accuracy OR Holiday Holiday GRAPHICAL TECHNIQUES 2 Rates of change REVISION REVISION Analyse Critically 3 AND GRAPHICAL TECHNIQUES 3 Exponential Functions Year 12

  4. View next page Introduction to Spreadsheets (Slide 1 of 2)

  5. Introduction to Spreadsheets (Slide 2 of 2)

  6. Types of Data

  7. Collecting Data

  8. Numerical calculations

  9. View next page Percentages (Slide 1 of 2)

  10. Percentages (Slide 2 of 2)

  11. Fermi Estimation

  12. Representing Data Numerically 1

  13. Representing Data Diagrammatically 1

  14. Interest Rates

  15. Equation of a straight line

  16. Collecting and Sampling Data

  17. View next page The Normal Distribution (Slide 1 of 2)

  18. The Normal Distribution (Slide 2 of 2)

  19. Critical Path Analysis

  20. View next page Graphical Methods (Slide 1 of 2)

  21. Graphical Methods (Slide 2 of 2)

  22. Review and recap 1

  23. View next page Solution to financial problems (Slide 1 of 2)

  24. Solution to financial problems (Slide 2 of 2)

  25. Perimeter, Circumference and Area

  26. Similarity and Pythagoras’ Theorem

  27. Analyse Critically 1

  28. Surface area and similarity

  29. Project work: Analysis of data or Personal Finance

  30. Review and recap 2

  31. Representing Data Diagrammatically 2

  32. Representing Data Numerically 2

  33. Graphical representation

  34. View next page Correlation and regression (Slide 1 of 3)

  35. Correlation and regression (Slide 2 of 3)

  36. Correlation and regression (Slide 3 of 3)

  37. View next page Expectation (Slide 1 of 2)

  38. Expectation (Slide 2 of 2)

  39. View next page Rates of change (slide 1 of 2)

  40. Rates of change (slide 2 of 2)

  41. Analyse Critically 2

  42. Review and recap 3

  43. Repayments and credit

  44. Taxation: Value Added Tax (VAT)

  45. Limits of accuracy

  46. Review and recap 4

  47. View next page Probabilities and estimation (Slide 1 of 2)

  48. Probabilities and estimation (Slide 2 of 2)

  49. View next page Cost benefit analysis (Slide 1 of 2)

  50. Cost benefit analysis (Slide 2 of 2)