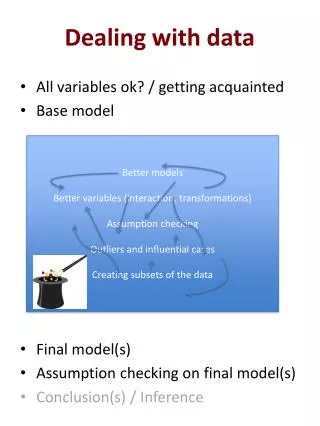
Dealing with Data
This comprehensive guide covers the essential functions of the TI-83 Graphing Calculator for effective data analysis. Learn how to graph functions, manage data lists, create visual graphs from lists, and perform regression analysis. Step-by-step instructions detail how to manually enter data, navigate lists, and set up your graphing window. Master the use of statistical operations to determine the line of best fit and discover the power of programs to automate tasks. Ideal for students looking to enhance their calculator skills and streamline their mathematical processes.

Dealing with Data
E N D
Presentation Transcript
Dealing with Data Basic Steps to Using the TI-83 Graphing Calculator
What we are going to cover • Graphing functions • Data Lists • Graphing Lists • Regression Analysis • Programs
Guess What? Everything you will see today you could do with a spreadsheet or graphing program
1. Lists • 6 columns that hold data • Data can be manually entered • Hit STAT then Edit (choice 1) • Use the arrow keys to navigate between lists • To clear a list: • Highlight the list name • Hit clear then enter
2. Graphing Lists • Hit 2nd then STAT PLOT • Turn on plot (others off) • Graph type • Data locations • Mark type
3. Setting the window • Manually enter values • Automatically by using a ZOOM feature, such as Zoom, then 9
4. Graph the data • Press Graph (for manually set windows) • or Zoom, then 9 (for automatically set windows)
5. Determine line-of-best-fit (regression analysis): • Choose STAT • Use the arrow key to navigate to CALC • Select the type of statistical operation you wish to perform • The operation will be performed on the active plots.
Graphing Functions • You can specify an equation to graph • Y = button • Enter the right side of the equation • Use the X,T,θ,n, button to insert a variable • Hit GRAPH to see the plot
Programs • With programs on the TI-83 • You can automate processes • Share them from calculator to calculator • Connect to and use external devices such as sensors
Transferring Programs • Connect two calculators using the link cable • Hit 2nd then LINK • Use the left and right arrow keys to choose between send or receive.
Running Programs • Hit PRGM • Select the program you want to run and hit enter.
Homework • Learn how to do one new thing on your calculator. • Turn in a brief summary of what you learned and step by step directions for how to do it.