
Advances in Error Covariance Modelling Using Wavelets for Data Assimilation
This study focuses on enhancing error covariance modeling in data assimilation through wavelet transforms. It addresses challenges related to the large size of the B-matrix and proposes a factorization approach utilizing sparse matrices and the square root of B for multivariate covariance aspects. The paper discusses desirable features for spatial covariance, assesses covariance model performance, and critiques the current Met Office model. Moreover, a novel waveband summation approach is introduced to efficiently manage covariance structures, enabling improved diagnostics and analyses.

Advances in Error Covariance Modelling Using Wavelets for Data Assimilation
E N D
Presentation Transcript
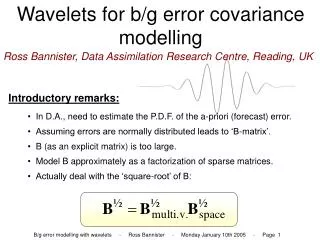
Wavelets for b/g error covariance modelling Ross Bannister, Data Assimilation Research Centre, Reading, UK Introductory remarks: • In D.A., need to estimate the P.D.F. of the a-priori (forecast) error. • Assuming errors are normally distributed leads to ‘B-matrix’. • B (as an explicit matrix) is too large. • Model B approximately as a factorization of sparse matrices. • Actually deal with the ‘square-root’ of B:
Why this particular factorization? The ‘parameter’ transform. Deals with multivariate aspects of covariances. The spatial transform (‘vertical’ and ‘horizontal’) deals with the spatial aspects of covariances (within each variable). Why the square-root? The square-root is interpreted as a transformation between control variables and model variables.
Coming up … • What spatial covariance features are desirable to capture? • How do we assess the covariance model performance (without doing data assimilation)? • What is ‘wrong’ with the current Met Office model of ? • The new ‘waveband summation’ approach. • My simplified study. • Summary and references.
1. Aspects of spatial covariances Uninspiring/impossible to look at matrix operators and so instead plot diagnostics derived from the operators. Two parts of covariance: (i) variance and (ii) correlation Each can be plotted in ‘real’-space or in ‘spectral’-space. Examples given in the literature … MetO: Ingleby N.B., Q.J.R.Meteor.Soc. 127, 209-231 (2001). ECMWF: Derber J. & Bouttier, Tellus 51A, 195-221 (1999).
2. Diagnostics 1. The real-space structure functions: allow us to compute variances, position dependent vertical correlations, and lengthscales) in real-space, 2. (Similar formulae exist for spectral-space.)
nearly BAD GOOD little can 3. The Met Office operational spatial error covariance model Vertical transform Horizontal transform (isotropic and homogeneous correlation model) 1. GOOD: The structure functions are non-separable. association between vertical and horizontal scales. 2. BAD: The transform cannot represent fully the position-dependent variances. Need an alternative that achieves (1) and (2) simultaneously.
Spectral bandpass fn Standard deviation field (diagonal matrix) Vertical transform (now band-dependent and redesigned to be position dependent) Horizontal transform (same design as before) GOOD: This transform will allow position dependencies (through design of ) and scale dependencies (through presence of ). COMPROMISE: The transform cannot represent position and scale dependencies perfectly (c.f. Heisenberg uncertainty principle). How does this transform compare to the Met Office transform? 4.The waveband summation (WS) covariance model
5. This study • A simplified set-up: • 2d only (lat/ht). • Reduced resolution. • Only one variable (temperature). • Small number of diagnostics: • Study the models: • For each model: • Explicit covariance matrix. • Implied diagnostics from the MetO cov model. • Implied diagnostics from the WS cov model (vary No. of bands). • Real-space variances. • Position dependent vertical correlations. • Scale dependent vertical correlations. • Lengthscales. Perform the calibration (determine numbers to used in transforms) by examining f/c differences. Compute diagnostics.
5. This study: MetO results Real-space T variances Vertical T corrs (fn. of posn.) Vertical T corrs (fn. of scale) Diagnostics from the explicit B-matrix (control) Diagnostics from the MetO B-matrix model
5. This study: WS results Real-space T variances Vertical T corrs (fn. of posn.) Vertical T corrs (fn. of scale) Diagnostics from the explicit B-matrix (control) Diagnostics from the WS B-matrix model (1 band)
5. This study: WS results Real-space T variances Vertical T corrs (fn. of posn.) Vertical T corrs (fn. of scale) Diagnostics from the explicit B-matrix (control) Diagnostics from the WS B-matrix model (2 bands)
5. This study: WS results Real-space T variances Vertical T corrs (fn. of posn.) Vertical T corrs (fn. of scale) Diagnostics from the explicit B-matrix (control) Diagnostics from the WS B-matrix model (3 bands)
5. This study: WS results Real-space T variances Vertical T corrs (fn. of posn.) Vertical T corrs (fn. of scale) Diagnostics from the explicit B-matrix (control) Diagnostics from the WS B-matrix model (4 bands)
5. This study: WS results Real-space T variances Vertical T corrs (fn. of posn.) Vertical T corrs (fn. of scale) Diagnostics from the explicit B-matrix (control) Diagnostics from the WS B-matrix model (5 bands)
5. This study: WS results Real-space T variances Vertical T corrs (fn. of posn.) Vertical T corrs (fn. of scale) Diagnostics from the explicit B-matrix (control) Diagnostics from the WS B-matrix model (6 bands)
6. Summary and References • The explicit B-matrix has many properties. • - Revealed in diagnostics. • - Cannot use explicit B-matrix in operational DA. • - Need a managable ‘B-matrix-model’ that replicates the essential features of B. • - (Model square-root of B as a control variable transform.) • Concentrate here on the spatial aspects of B. • The MetO operational spatial B-model: - It is cable of capturing non-separable aspects, - It cannot represent position and scale dependencies simultaneously. • The new WS spatial B-model: - It is cable of capturing non-separable aspects, - It can represent position and scale dependencies simultaneously, - Involves a trade-off between resolution in real- and spectral-spaces. - Some properties can be investigated analytically. • References - file:///home/mm0200/frxb/public_html/WS/Waveband.html (MetO intranet) - www.met.rdg.ac.uk/~ross/DARC/WS/Waveband.html