Download

1 / 27
270 likes | 408 Vues
Using VMS data to predict fishing effort Dr Janette Lee 7 January 2009. Vessel Monitoring System (VMS). 2 hourly satellite location of vessels EU legislation for vessels > 15m Cefas has access to UK vessels & foreign vessels in UK waters Collected for operational enforcement

E N D
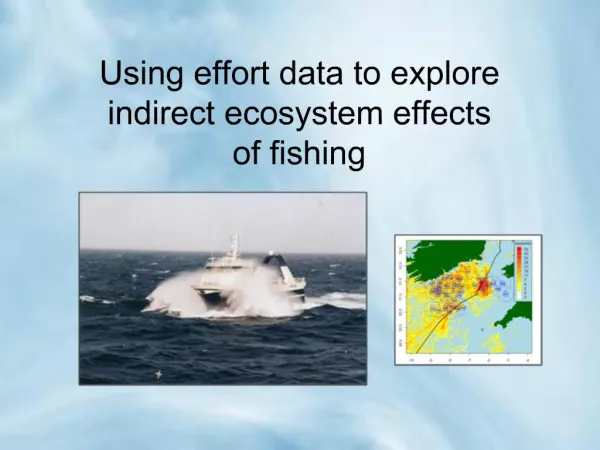
Using VMS data to predict fishing effortDr Janette Lee7 January 2009
Vessel Monitoring System (VMS) • 2 hourly satellite location of vessels • EU legislation for vessels > 15m • Cefas has access to UK vessels & foreign vessels in UK waters • Collected for operational enforcement • Secondary use for science: estimating fishing effort • Of limited use to science unless it can be linked to fishing gear used
Catch data Vessel data VMS data Discard data Logbook data DATABASE Algorithms GIS
Extracting the data … • Using a combined database of vessel information, log book details, commercial landings and positional information, data can be selected by: • specified dates • geographical region • fishing vessels nationality • gear type • fish species
Identifying fishing or steaming … Speed alone allowed successful estimation (~96% correct) of fishing/ steaming activity from VMS data in 3 fleets around England and Wales Mills, C. M., Townsend, S. E., Jennings, S., Eastwood, P. D., and Houghton, C. A. 2007. Estimating high resolution trawl fishing effort from satellite-based vessel monitoring system data. – ICES Journal of Marine Science, 64: 248–255.
From points to surfaces …removal of ‘bad’ data • Duplicate VMS points: same lat/long, date, time, vessel id • VMS points within 1km of a port and with a speed of 0 knots • VMS points falling ‘inside’ the boundary of the coastline
Speed Bands for Fishing Activity(from Mills et al. 2007) • Beam Trawls (TBB): 2-8 knots • Boat Dredges (DRB): 2-8 knots • Mechanised Dredges (HMD): 2-8 knots • Bottom Otter Trawls (OTB): 1-6 knots • Midwater Otter Trawls (OTM): 1-6 knots • Twin Otter Trawls (OTT):1-6 knots
Speed Bands for Fishing Activity: Pots (FPO) • 1,005 overflight sightings identified as fishing using FPO gear between 2005 and 2007 • 865 of these (86%) fall within the 12-mile limit • The average speed is 1.02 knots (std.dev = 1.35) • 20 out of 1,005 sightings (2%) record speeds in excess of 3 knots • 593 out of 1,005 sightings (59%) record a speed of zero • Speed <= 3 knots was used to filter VMS records as fishing • There are NO records in the observer database for potting
Speed Bands for Fishing Activity: Set Gillnets, anchored (GNS) • 391 overflight sightings identified as fishing using GNS gear between 2005 and 2007 • 205 of these (52%) fall within the 12-mile limit • The average speed is 1.7 knots (std.dev = 1.6) • 4 out of 391 sightings (1%) record speeds in excess of 4 knots • 166 out of 391 sightings (42%) record a speed of zero • Speed <= 4 knots was used to filter VMS records as fishing • Data for 200 hauls observed in 2006 and 2007 • The time between shooting and hauling of nets ranged from 8hr 30mins to 96hrs (average=22 hrs) • Distance between shoot location and haul location ranged from 0 to 7 nautical miles (average=2 Nm)
Speed Bands for Fishing Activity: Driftnets (GND) • 327 overflight sightings identified as fishing using GND gear between 2005 and 2007 • 7 of these (2%) fall within the 12-mile limit • The average speed is 3 knots (std.dev = 1.7) • 7 out of 327 sightings (2%) record speeds in excess of 3 knots • 17 out of 327 sightings (5%) record a speed of zero • Speed <= 3 knots was used to filter VMS records as fishing • There are NO records in the observer database for driftnets
VMS Time Interval • The actual ‘time interval’ is determined by computing the difference in the VMS time stamp for consecutive records for the same vessel ID • If the calculated time interval for a given VMS record is > 4 hours (i.e. two VMS records have been missed) then the VMS record is flagged as being the ‘start’ of a new trip and a default ‘time interval’ of 2 hours is assigned
Fishing Activity Grid • A sum of the ‘time interval’ for all VMS points falling within each cell of a 0.05 degree grid is computed • This summation can be carried out for any specified time period (monthly, quarterly, annually) and for any specified gear code • Grids can easily be added to e.g. produce annual values from the summation of four quarterly grids; or to produce details for gear grouping by summing the grids for specified gears
The thin white line … … inshore waters !
Filling the gap … Project has just started in partnership with SSFDC: • Eastern English Channel area • To identify methods to integrate inshore observations and offshore VMS data • To try to develop methods that produce the same reference scale for both areas • To compensate for the different sampling intervals of the datasets