Download
1 / 42
420 likes | 608 Vues
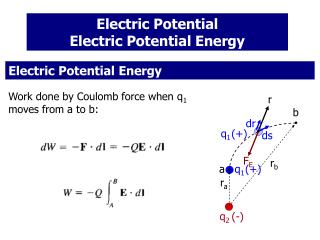
Economic Market Potential for Electric Utility Use of Distributed Generation. For The Edison Electric Institute June 20, 2001 By Joe Iannucci (925) 447-0604 joe@dua1.com. Introduction Methodology Overview Assumptions: Utility and DG DG Economic Market Potential

E N D
Economic Market Potential for Electric Utility Use of Distributed Generation For The Edison Electric Institute June 20, 2001 By Joe Iannucci (925) 447-0604 joe@dua1.com
Introduction Methodology Overview Assumptions: Utility and DG DG Economic Market Potential Observations and Conclusions R&D Needs and Opportunities Agenda EEI_DG_2001_Results
Utility Economics • lower cost of service • better asset utilization • improved operation • Substation and feeder locations EEI_DG_2001_Results
Economic Market Potential DR Cost Utility Avoided Cost “Value Mountain” Illustration EEI_DG_2001_Results
Peak Load and Load Growth,Load “In-play” • TECHNICAL Potential = Load Growth • NERC Load GROWTH Projections • Increase “Direct” Load Growth to account for Load Diversity • multiply by 1.6, approximate ratio of end-of-line transformer capacity(kVA* power factor) central load(kW) • 2002: 21,822 MW 2010: 22,205 MW EEI_DG_2001_Results
DG Hours of Operation • Peak Load: 200 Hours/year • Base Load: 5,256 hours/year • load factor .6 EEI_DG_2001_Results
DG Fuel Price Assumptions • Base Case • relatively flat gas and coal prices • High Fuel Cost Case • gas price based on futures price, Feb 2001 • assume coal prices “track” gas prices • Natural Gas Volume-based Prices @ Substation: Wholesale On-site: Retail • Transportation Charges per EIA/NEMS, added to Commodity Prices EEI_DG_2001_Results
DG Natural Gas Prices Assumed • DG Natural Gas Prices Assumed • Forward Averaged • Diesel Fuel: EIA Retail Price Forecast EEI_DG_2001_Results
Peak Load Electricity Cost Assumptions • “blend” of common peaking resources’ • capacity cost • O&M • fuel cost EEI_DG_2001_Results
Baseload Electric Energy Cost Assumptions • Base Case and High Case Fuel Cost Cases • “Blend” of combined cycle gas and coal. • Annual Cost $/kW-yr mean high low EEI_DG_2001_Results
Utility T&D Capacity Cost Assumptions • FERC Form 1 T&D Budgets • Load Growth per NERC Forecasts • Statistical Spread Derived Assuming Mean Values of: $/kW-year Transmission $12.1 Distribution $41.9 EEI_DG_2001_Results
Other Utility Assumptions • Value-of service & “Reliability Benefits” • applies at feeder locations • assume cause for 99% of outages beyond substation • outage losses “avoided” • outage rate .029% * 8760 = 2.5 hours per year • Value of service (unserved energy) $3/kWh • TOTAL: 2.5 hours * $3/kWh = $7.50/kW-year • T&D Losses • affects fuel use and grid capacity needs average: 4% on-peak: 7% ~ 8% of total! EEI_DG_2001_Results
Peaking Distributed Generators’ Cost and Performance 2002 2010 EEI_DG_2001_Results
Baseload Distributed Generators’ Cost and Performance 2002 2010 EEI_DG_2001_Results
Economic Market Potential Estimates, Peak 2002 Base Case Fuel Prices High Fuel Prices EEI_DG_2001_Results
Economic Market Potential Estimates, Peak 2010 Base Case Fuel Cost High Fuel Cost EEI_DG_2001_Results
Value Mountain 2002 Peaker, Feeder Location EEI_DG_2001_Results
Observations and Conclusions Peaker DGs • very competitive with respect to total annual cost to serve new load as capacity resources EEI_DG_2001_Results
Value Mountain 2002 Baseload, Feeder Location EEI_DG_2001_Results
Results, Baseload • Markets are essentially zero with two important exceptions. • ATS • all at sub (low cost gas), base case fuel price only 2002: ~29% 2010: <3% • Advanced Fuel Cell • all at sub (low cost gas), 2010 only 2010 base case fuel prices: 68.3% 2010 high fuel prices: 4.1% EEI_DG_2001_Results
Baseload DGs: Observations • Difficult for even superior DGs to compete with grid as utility-owned energy resource, especially with regard to • production cost / wholesale price of electricity • capacity cost for new central generation • Conversely: Viability Very Sensitive to Fuel Price and Efficiency • “Low cost,” efficient fuel cells can compete for “small” portion of load growth EEI_DG_2001_Results
Baseload DGs: Conclusions • May need one or more of the following • more run hours • DGs with even lower cost than expected • DGs with even higher efficiency than expected • CHP benefits • Aggregated/Bulk Purchases of Gas • to reduce fuel cost for feeder/customer locations EEI_DG_2001_Results
Caveats and Considerations • “Economic Market Potential” • based purely on direct cost-effectiveness for meeting load growth • based on utility annual (avoided) cost ($/kW-year) • without regard to institutional challenges • Estimates made assuming that technologies are commercially viable and readily available. EEI_DG_2001_Results
Caveats and Considerations • Baseload and Peaking duty cycles evaluated in isolation. • Each DG evaluated individually • without regard to substitutes(i.e., other types of distributed generation, storage, or geographically targeted DSM) • Assumed fuel access and availability. EEI_DG_2001_Results
Implementation Issuesor, if it’s so good why isn’t it happening? • EXCEPTION: increasing use of DGs for “supply” benefits… …limited regard to “local” benefits (T&D)… ...for now? EEI_DG_2001_Results
Implementation Issuesor, if it’s so good why isn’t it happening? • Complexity • versus planning of “conventional” option: Fuel + G + T + D • Not Standard Engineering Practice • Insufficient Evaluation Tools – engineering – financial • Insufficient Data EEI_DG_2001_Results
Implementation Issuesor, if it’s so good why isn’t it happening? • Financials • utility-owned DGs -- financing and rules? • lease or rent DGs -- strains modest utility expense budgets (especially distribution) • benefits sharing arrangements/partnerships? • Intra-utility Discontinuities • overlapping / divergent missions • uncertain incentives • Emissions Issues EEI_DG_2001_Results
R&D Needs and Opportunities • Utility Markets Topics • Plant Capital Cost Sensitivities • Regional Analysis • Activate Customer-owned Backup Generators as Utility Resource • Intermediate Load DG Operation, i.e., • Peak/capacity DG’s seem great • difficult for baseload/energy DG’s to compete • Air Emissions Implications EEI_DG_2001_Results
R&D Needs and Opportunities • Customer Perspective Market Potential • Bill Reduction • Customer Perspective, segments • commercial – institutional • industrial – IT operations • DR Options –CHP –Targeted Demand Management –Storage EEI_DG_2001_Results
Backups EEI_DG_2001_Results
Comparing Central to DU Solutions Bill and Benefits Comparison DUVal-C cost and Purchasingpower benefits of DG options Customer Economics • lower energy bill • better service--quality, reliability EEI_DG_2001_Results
Institutional Customer Bill Analysis Results Summary EEI_DG_2001_Results
Diesel Gensets, Cost Versus B/C Ratio EEI_DG_2001_Results
Customer Bill Reduction Potential (Economic Benefits) EEI_DG_2001_Results
Customer Bill Analysis with Resulting DG Air Emissions EEI_DG_2001_Results
Emissions Due to Cost-effective Utility Use of DG EEI_DG_2001_Results
DG Gas Price Details EEI_DG_2001_Results
Peaking Generation Cost Details Year 2002 EEI_DG_2001_Results
Peaking Generation Cost Details Year 2010 EEI_DG_2001_Results
T&D Cost Calculations Details • Load Diversity Factors T = 1.2 D = 1.6 • Fixed Charge Rates T = .1100 D = .1100 EEI_DG_2001_Results
Economic Market Potential Estimates Details Year 2002 Base Case Fuel Cost High Fuel Cost EEI_DG_2001_Results
Economic Market Potential Estimates Details Year 2010 Base Case Fuel Cost High Fuel Cost EEI_DG_2001_Results