Reducing Chronic Absence
Reducing Chronic Absence. What Will It Take?. 2014. What is Chronic Absence? What is the difference from ADA and truancy?. High Levels of Average Daily Attendance (ADA) Can Mask Chronic Absence. 90% and even 95% ≠ A. 98% ADA = little chronic absence 95% ADA = don’t know

Reducing Chronic Absence
E N D
Presentation Transcript
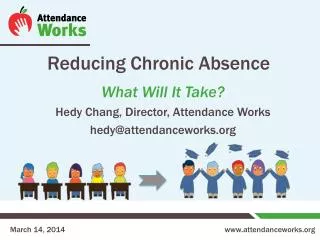
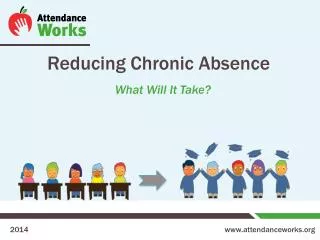
Reducing Chronic Absence What Will It Take? 2014
What is Chronic Absence? What is the difference from ADA and truancy?
High Levels of Average Daily Attendance (ADA) Can Mask Chronic Absence 90% and even 95% ≠ A 98% ADA = little chronic absence 95% ADA = don’t know 93% ADA = significant chronic absence
Why Does Attendance Matter For Achievement? What we know from research around the country
Starting in PreK, More Years of Chronic Absence = Need for Intensive Reading Support By 2nd Grade Some risk At risk * Indicates that scores are significantly different from scores of students who are never chronically absent, at p<.05 level; **p<.01; ***p<.001
Students Chronically Absent in Kindergarten and1st Grade are Much Less Likely to Read Proficientlyin 3rd Grade Source: Applied Survey Research & Attendance Works (April 2011)
The Long-Term Impact of Chronic Kindergarten Absence is Most Troubling for Poor Children 5th Grade Math and Reading performance by K attendance for children living In poverty. Academic performance was lower even if attendance had improved in 3rd grade. Source: ECLS-K data analyzed by National Center for Children in Poverty (NCCP) Note: Average academic performance reflects results of direct cognitive assessments conducted for ECLS-K.
Multiple Years of Elementary Chronic Absence = Worse Middle School Outcomes Each year of chronic absence in elementary school is associated with a substantially higher probability of chronic absence in 6th grade 18.0x • Chronic absence in 1st grade is also associated with: • Lower 6th grade test scores • Higher levels of suspension Increase in probability of 6th grade chronic absence 7.8x 5.9x Years of Chronic Absence in Grades 1-5 Oakland Unified School District SY 2006-2012, Analysis By Attendance Works
By 6th grade, chronic absence predicts high school drop out. High School Outcomes by Rates of Chronic Absenteeism in Sixth Grade (Baltimore City Public Schools, 1990-00 Sixth Grade Cohort) Source: Baltimore Education Research Consortium
The Effects of Chronic Absence on Dropout Rates Are Cumulative With every year of chronic absenteeism, a higher percentage of students dropped out of school. http://www.utahdataalliance.org/downloads/ChronicAbsenteeismResearchBrief.pdf
Attendance Is Even More Important For Graduation for Students In Poverty Presentation to: The Interagency Council for Ending the Achievement Gap November 7, 2013, CT State Dept of Education.
What Do We Know About Chronic Absence in [Insert your community]?
What Does Chronic Absence Look Like in Our District? Sample District-wide Chronic Absence Data, Single Year PLACEHOLDER If it is available, add in your district data here. Sharing data with stakeholders is a helpful– but not necessary-- step for designing a community action plan. If you do not have chronic absence data available, feel free to delete this slide.
Is Chronic Absence Increasing or Decreasing Over Time? Sample District-wide Chronic Absence Data, 3-Year Trend PLACEHOLDER If it is available, add in your district data here. Sharing data with stakeholders is a helpful– but not necessary-- step for designing a community action plan. If you do not have chronic absence data available, feel free to delete this slide.
Are Certain Subgroups of Students More Affected By Chronic Absence? Sample District-wide Data, Single Year by Gender PLACEHOLDER If it is available, add in your district data here. Sharing data with stakeholders is a helpful– but not necessary-- step for designing a community action plan. If you do not have chronic absence data available, feel free to delete this slide. 39% 35% 33% 19% 16% 13% High Elementary Middle Moderate Chronic Absence Severe Chronic Absence
Are Certain Subgroups of Students More Affected By Chronic Absence? Sample Data, Percentage of Students Chronically Absent in Each Grade, by Race/Ethnicity PLACEHOLDER If it is available, add in your district data here. Sharing data with stakeholders is a helpful– but not necessary-- step for designing a community action plan. If you do not have chronic absence data available, feel free to delete this slide.
Find Out Why Students Are Chronically Absent Chronic disease
Site-Level Strategies for Building a Culture of Attendance & Identifying Barriers
Local Examples of Effective Practice If there are schools in your district that have improved attendance and are maintaining low levels of chronic absence, consider asking them to share what they do
Increased Attendance Involves a 3-Tiered Approach that Fits with Most Reform Efforts Students who were chronically absent in prior year or starting to miss 20% or more of school A small fraction of a school’s students High Cost Recovery Programs Some of a school’s students Students at risk for chronic absence Universal/Preventive Programs Intervention Programs All students in the school All of a school’s students Low Cost
Ingredients for System-wide Success & Sustainability Option A – use this diagram or the version on the next slide District Community Conveys why building a habit of attendance is important and what chronic absence is Is accurate, accessible, and regularly reported Positive Messaging Actionable Data Schools Students & Families Shared Accountability Capacity Building Ensures monitoring & incentives to address chronic absence Expands ability to interpret data and work together to adopt best practices Strategic partnerships between district and community partners address specific attendance barriers and mobilize support for all ingredients
Ingredients for System-wide Success &Sustainability Option B – use this diagram or the version on the previous slide Site-Level Strategies Positive Messaging Actionable Data Capacity Building Shared Accountability Conveys why building a habit of attendance is important and what chronic absence is Is accurate, accessible, and regularly reported Expands ability to interpret data and work together to adopt best practices Ensures monitoring and incentives and sets expectations for school leaders and teachers to address chronic absence Strategic Partnerships between schools, agencies, and community partners address attendance barriers and mobilize support for all ingredients 23
What Comes Next? Take a moment to reflect and react to the strategies discussed in this deck Work through the District Self-Assessment Exercise, individually and then as a group