Download
1 / 23
270 likes | 823 Vues
Learn about the Analytical Hierarchy Process (AHP), a quantitative method for ranking decision alternatives based on criteria preferences. This method helps select the best alternative matching decision maker's criteria efficiently.

E N D
Analytical Hierarchy Process ( AHP ) By Jennifer McBride Operations Management May 6, 2003
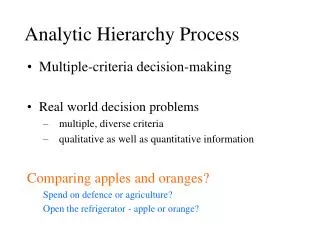
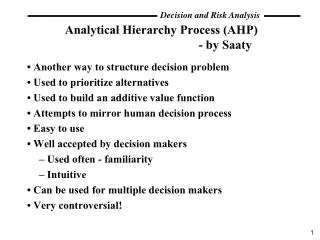
What is AHP ? • According to Operations Management 4th Edition by Russell and Taylor III it is a quantitative method for ranking decision alternatives and selection the one given multiple criteria. AHP is a process for developing a numerical score to rank each decision alternative based on how well each alternative meets the decision maker’s criteria.
What does it answer ? • The question “Which one do we choose?” or “Which one is best ?” by selecting the best alternative that matches all of the decision maker’s criteria.
What does it use ? • Simple mathematics • criteria < set by the decision maker > • preferences of that criteria < also set by the decision maker> • the standard preference table
Standard Preference Table PREFERENCE LEVEL Equally preferred Equally to moderately preferred Moderately preferred Moderately to strongly preferred Strongly preferred Strongly to very strongly preferred Very strongly preferred Very strongly to extremely preferred Extremely preferred NUMERICAL VALUE 1 2 3 4 5 6 7 8 9
Why not make up your own preference table ? • Because the standard preference table has been determined by experienced researchers in AHP to be a reasonable basis for comparing two alternatives.
How is it used ? • Say you have two criteria. Cost and quality for product A & B. The cost for A= $60 and the quality is above average. The cost for B=$15 and the quality is right at average. Which do you choose? By making a matrix the price of B is very strongly preferred to A and A is only moderately preferred to B. The matrices of these preferences would look like . . . .
Since price B is very strongly preferred to the price of A. The score of B to B is 7 and A to B is the reciprocal or inverse of 1/7 Matrices of A and B COST A B A 1 7 B 1/7 1 COST A B A 1 7 B 1/7 1 QUALITY A B A 1 1/3 B 3 1
Our sample problem Jilley Bean Co. is selecting a new location to expand its operations. The company want to use AHP to help it decide which location to build its new plant. Jilley Bean Co. has four criteria they will base their decision on these are the following: property price, distance from suppliers, the quality of the labor pool, and the cost of labor. They have three locations to decide from.
Matrices given criteria and preferences PRICE A B C A 1 3 2 B 1/3 1 1/5 C 1/2 5 1 PRICE A B C A 1 3 2 B 1/3 1 1/5 C 1/2 5 1 DISTANCE A B C A 1 6 1/3 B 1/6 1 1/9 C 3 9 1 LABOR A B C A 1 1/3 1 B 3 1 7 C 1 1/7 1 • Showing that in preference in price A and C are the equally preferred but are preferred over B. WAGES A B C A 1 1/3 1/2 B 3 1 4 C 2 1/4 1
How it is done ~ STEP ONE PRICE A B C A 1 3 2 + + + B 1/3 1 1/5 + + + C 1/2 5 1 = 11/6 9 16/5 PRICE A B C A 1 3 2 + + + B 1/3 1 1/5 + + + C 1/2 5 1 = 11/6 9 16/5 • First sum (add up) all the values in each column.
How it is done ~ STEP TWO PRICE A B C A 1+11/6 = 6/11 3+9 = 3/9 2+16/5 = 5/8 + + + B 1/3+11/6 = 2/11 1+9 = 9 1/5+16/51/16 + + + C 1/2+11/6 = 3/115+9 = 5/91+16/5 = 5/16 = 1 1 1 • Next the values in each column are divided by the corresponding column sums. NOTICE: the values in each column sum to 1.
How it is done ~ STEP THREE PRICE A B C Row Average A 6/11 ~.5455 + 3/9~.3333 + 5/8~ .6250 = 1.5038 +3 = .0512 B 2/11~.1818 + 1/9~.1111 + 1/16~.0625 = .3544 +3 = .1185 C 3/11~.2727 + 5/9~.5556 + 5/16~.3803 = 1.2086 +3 = .3803 1.000 • Next convert fractions to decimals and find the average of each row.
How it is done ~ STEP FOUR Find the average for all the criterion by doing steps 1-3 on all the criteria. Arriving at the following Location Price Distance Labor Wages A .5012 .2819 .1790 .1561 B .1185 .0598 .6850 .6196 C .3803 .6583 .1360 .2243
How it is done ~ STEP FIVE Rank the criteria in order of importance ~use the same method used in ranking each criterion. Criteria Price Distance Labor Wages Price 1 1/5 3 4 Distance 5 1 9 7 Labor 1/31/9 1 2 Wages 1/41/7 1/2 1
How it is done ~ STEP 6-9 • Repeat steps 1-4 with the new matrices. You should arrive at the following : Criteria Price Distance Labor Wage Row Average Price .1519 .1375 .2222 .2857 .1933 Distance .7595 .6878 .6667 .5000 .6535 Labor .0506 .0764 .0741 .1429 .0860 Wage .0380 .0983 .0370 .0714 .0612 1.000
Row average= preference vector for the criteria CRITERIA Price .1993 Distance .6535 Labor .0860 Wage .0612 • Clearly the price of the land is #1, followed by distance to suppliers, labor pool quality, and last cost of wages.
FINAL CALCULATIONS Take the criteria matrix and multiple it by the preference vector CRITERIA Price .1993 Distance .6535 Labor .0860 Wage .0612 Location Price Distance Labor Wages A .5012 .2819 .1790 .1561 B .1185 .0598 .6850 .6196 C .3803 .6583 .1360 .2243 X Location A score = .1993(.0512) + .6535(.2819) + .0860(.1790) +.0621(.1561) = .3091 Location B score = .1993(.1185) + .6535(.0598) + .0860(.6850) + .0612(.6196) = .1595 Location C score = .1993(.3803) + .6535(.6583) + .0860(.1360) + .0612(.2243) = .5314
And the results are . . . LOCATION Score A .3091 B .1595 C .5314 1.0000 Based on the scored Location C should be chosen for Jilley Bean Co. to built a plant.
How is AHP is used in real life ? • Expert Choice a company that specializes in AHP design software and performs services with it. Some of their clientele are: • Ford Motor Company • Sprint PCS • Department of Agriculture (USDA) • Navy • National Health Service of the United Kingdom • Ferrari SpA in Italy
How is AHP is used in real life ? • The USDA used it for the selection of bridge materials across the nation in several states.
Is there anything AHP cannot be used for ? • Not really as long as the decision maker has set criteria and set preferences of that criteria AHP can be used.
References • Russell, Roberta S. and Taylor III, Bernard W. Operations Management 4th edition. Upper Saddle river, New Jersey: Prentice Hall, 2003. • Expert Choice Client List <http://expert choice.com/customers/client list.htm • Smith, Bush and Schmoldt. The Selection of Bridge Materials Utilizing the Analytical Hierarchy Process. 5 March 2003. <http://www/srs4702.forprod.vt.edu/pubsubj/abstract/ab9760.