Download
1 / 48
490 likes | 1.02k Vues
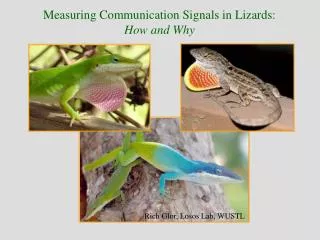
Measuring Communication Signals in Lizards: How and Why Rich Glor, Losos Lab, WUSTL I. Introduction to communication A. Definition B. Brief history (Marler 1967) C. My approach/outlook II. Communication in lizards A. Anolis carolinensis display description (DeCourcy

E N D
Measuring Communication Signals in Lizards: How and Why Rich Glor, Losos Lab, WUSTL
I. Introduction to communication A. Definition B. Brief history (Marler 1967) C. My approach/outlook II. Communication in lizards A. Anolis carolinensis display description (DeCourcy & Jenssen 1994) 1. Function 2. Ontogeny 3. Causation 4. Evolution
A. Definition “Evolution hates definitions; for every tidy definition a biologist constructs, evolution will have provided some exception.” Bradbury & Vehrencamp 1998 Proposed Definition: Information transfer from sender to receiver
Wayne Lynch National Wildlife Federation e.g., Tuttle & Ryan 1981
Nature 2004 Nature 2004
Starring Greg Pryor, University of Florida (more specifically, his toe), & an unidentified male Anolis sagrei
Revised Definition: Communication is the phenomenon of one organism producing a signal that, when responded to by another organism, confers some advantage (or the statistical probability of it) to the signaler Burghardt 1970 Signal Sender Receiver Environment Decision & Response
Signal Sender Receiver Environment Decision & Response Signals vs. Cues Receivers vs. Eavesdroppers
B. Brief history *Animal communication as a scientific discipline has a recent past Lorenz Ethologists 1940’s-60’s Tinbergen NATURE/Instinct Von Frisch Umvelt
*In contrast to PavlovBehaviorists 1890’s-1960’sWatson NURTURE/Learning Skinner Experimental Control
Definitions of communication: 1950’s-60’s For the “survival of the species” *Signaler/receiver cooperation 1960’s-80’s Individual benefit *Signaler/receiver competition 1980’s-present Synthesis *Honest and dishonest signals *Context-dependent decision making at the individual level
Dugatkin 2004 *Structure/Function relationships between signal mode and environment
C. My approach/outlook Tinbergen’s four questions (Tinbergen 1963) *Function *Ontogeny *Causation *Evolution N. Tinbergen 1907-1988
Anolis carolinensis range (U.S.) Modified from Conant & Collins, 1998 • Huge genus; only species endemic to North America • Polygynous social organization • Seasonal breeders (~ April-July) • Females lay single-egg clutches at ~ weekly intervals • No parental care • Communication via “headbobbing displays” • Excellent field and laboratory model
Anolis Communication(Jenssen, 1977, 1978) Headbobbing displays are body movements which raise and lower the head and dewlap Headbobbing displays can be divided into core and modifier components The core component is the display type; a species-specific headbobbing pattern that is performed predictably across all displays of the same type Display modifiers are postures or movements added to the display type, but they are neither species-specific nor predictably associated with any particular display type
A. Anolis carolinensis display description (DeCourcy & Jenssen 1994)
Display Action Pattern (DAP-)Graphing Charles C. Carpenter (e.g., Carpenter & Grubitz 1961)
Anolis carolinensis DAP-graph A B C 1 2 3 4 5 6 7 8 9 10 HEAD AMPLITUDE 1 2 5 6 7 8 9 10 5 6 7 8 9 10 0.0 0.5 1.0 1.5 2.0 DISPLAY DURATION (s)
The problem of function-labeling *Longstanding concern; widespread problem *Similar to problem of anthropomorphism One behavior many functions One function many behaviors Anolis carolinensis signaling repertoire good cautionary tale; Don’t name the behavior by the context in which it occurs!
An overview of subsequent A. carolinensis display work, via Tinbergen’s four questions: *Function – examination of sex differences in structure and use *Ontogeny – display description through development *Causation – proximate mediators, in this case, steroids (T) *Evolution – population-level analysis of structure
1. Function • Adult males and females use the same three stereotyped display types Jenssen, Orrell, Lovern 2000
Sex Differences in Adult Display Use Nunez, Jenssen, Ersland, 1997 Jenssen, Orrell, Lovern, 2000
More Sex Differences in Adult Display Use Males Females Advertisement Displays YES NO Territory Patrol Displays YES NO Ritualized Aggression YES NO Dewlap in Courtship YES NO Type C in Courtship YES NO Display Modifiers YES FEW Nunez, Jenssen, Ersland 1997, Jenssen, Orrell, Lovern 2000, Orrell & Jenssen 2003
Also: Jenssen, Greenberg, Hovde 1995 Jenssen & Nunez 1998 Jenssen, Lovern, Congdon 2001
Juvenile Display Structure • Juvenile males and females can display at hatching • Juvenile display structure does not differ by sex • Juvenile and adult display structure are the same • BUT stereotypy differs… Lovern & Jenssen 2003
Juvenile Display Use N=60 juveniles, 515 displays Size class: H = 15.7, P = 0.001 * N=30 each sex Lovern & Jenssen, 2001
Juvenile Display Use -- Continued Unlike Adults: • Social context has no effect on display type use • No advertisement displays, patrolling displays, ritualized aggression, courtship Lovern & Jenssen, 2001, 2003
Background on Steroids • Major class of hormones; highly evolutionarily conserved • Primarily synthesized by the gonads and adrenal glands • Circulate in bloodstream; affect target tissues throughout body via binding to steroid-specific receptors and subsequent modification of gene activity • Very small (0.5-1.0 pg) quantities can be reliably measured -- from a variety of tissue types -- by radioimmunoassay (RIA) • Sex steroids (androgens and estrogens) play major roles in sexual differentiation and adult reproductive function
Juvenile and Adult T Comparison *P < 0.001 * ADULTS JUVENILES * N = 8 50 21 44 Lovern, McNabb, Jenssen, 2001
Juvenile T-Implant Study P < 0.001 BLANK IMPLANTS T IMPLANTS a a b c N = 6 6 8 6 Lovern, McNabb, Jenssen, 2001
T Implant Study: Results Lovern, McNabb, Jenssen, 2001
Causation: Sexual dimorphisms in adult behavior likely arise through underlying physiological differences between males and females that mediate the expression of behavior, rather than through fundamental sex differences in the ability to perform sexually dimorphic behaviors.
4. Evolution Comparisons of Temporal Display Structure across Contexts and Populations in Male Anolis carolinensis:Signal Stability or Lability? Lovern, Jenssen, Orrell, Tuchak 1999
Objectives *To determine if males from three geographically distinct populations possess the same display types *To determine if males vary the temporal structure of display types (i.e., intra-display structure) across contexts, populations • Hypothesis:Due to recent founding of Hawaii population (ca. 1950), and dramatic climatic differences found there, we expected males in this population to express the highest degree of display type variability, potentially due to founder effects, genetic drift, and/or unique selective pressures of a tropical environment
Results I:Do Male Anolis carolinensis from Different Populations Possess the Same Display Types?YES Nearest Neighbor Discriminant Analysis GA: 100% (96%) FL: 99.5% (92%) HI: 100% (100%)
Results II:Do Male Anolis carolinensis Vary Display Type Structure across Populations?MAYBE... Intra-display structure Among GA, FL, and HI populations, totaldisplay duration was not significantly different for any display type However, 18/24 display units were significantly different: Display Type A: 6/10 Display Type B: 7/8 Display Type C: 5/6
Conclusions *Male Anolis carolinensis useall display types (A, B, C) in the field and lab, and in all contexts; display type structure is unaffected by these parameters *Males from three distinct populations (GA, FL, HI) possess the same three highly stereotyped -- but statistically distinguishable -- display types in their repertoires *Within relatively small total variance, among- and within-individual differences account for more of the existing variance than does population or context *Overall, male Anolis carolinensis show display type stability; males from HI show no evidence of increased display lability resulting from potential genetic and/or environmental influences from recent colonization of a novel habitat