Download
1 / 44
560 likes | 1.66k Vues
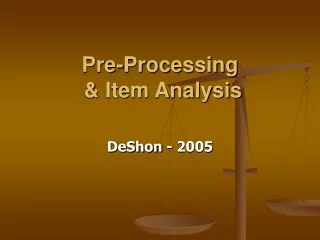
PRE-PROCESSING IN IMAGE ANALYSIS OF SATELLITE PICTURES. BEGÜM KÜLTÜR 110010205. Processing Satellite Imagery.

E N D
PRE-PROCESSING IN IMAGE ANALYSIS OF SATELLITE PICTURES BEGÜM KÜLTÜR 110010205
Processing Satellite Imagery • When the first satellite, Sputnik, was launched in 1957 no one could have foreseen how its diverse its use would become. Today, we have Direct TV, On-Star, XM Radio and live up-to-the-second television coverage from every corner of the world. Today, satellite information is being relayed back to earth every second of every day. Before Sputnik had completed it first orbit it had relayed the first data back to earth. And it was not the "oldies" station on XM Radio. It was environmental data. More than forty years later, the use of satellite imaging continues as the most popular provider of environmental monitoring. With recent demands for new levels of data we are presented with the problem of how to manipulate our new raw satellite images so that these images can be integrated with pre-existing environmental observations and methods.
In order to retrieve, manipulate and process raw satellite images we make use of commercial computer software, in particular ENVI (ENnvironment for Visualizing Images) written in IDL (Interactive Data Language).ENVI is used for data visualization and analysis of satellite images. With a full understanding of IDL and the use of key components of the Interactive Data Language, we are able to customize, compose and modify algorithms. This allows us to prompt and direct ENVI to meet our specific needs and tailor, to our needs, the processing of the satellite data.
Satellite data comes from the SeaStar, a polar orbiting satellite launched in 1997, which carries the SeaWiFS (Sea-viewing Wide Field-of-view Sensor) sensor. The SeaStar satellite travels at an altitude of about 1000 km above the Earth. It travels pole to pole in ninety-nine minutes. SeaWiFS is an eight-channel sensor sensing radiation in the range of 0.402-0.885 m m with a swath width of 2800-km. Radiation sensed by the eight channels of SeaWiFS comes from four sources: air (gas) scattering and absorption, aerosol scattering and absorption, cloud reflectance and surface reflectance (Fig.1).
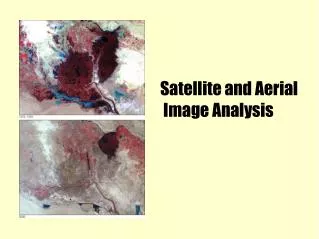
Satellite imagery used in the detection of change along coastlines is processed in a standardized fashion to ensure temporal, spatial, and spectral compatibility between scenes. Imagery is initially selected to correlate as closely as possible with season and time-of-year coincident with high biomass and favorable atmospheric conditions as appropriate per region.
Processing Steps Spot satellites can transmit image data to the ground in two ways, depending on whether or not the spacecraft is within range of a receiving station. As the satellite proceeds along its orbit, four situations arise concerning imagery acquisition and image data transmission to ground.
Processing Steps • The satellite is within range of a Direct Receiving Station (DRS), so imagery can be down-linked in real-time provided both satellite and DRS are suitably programmed. • The satellite is not within range of a Spot DRS. Programmed acquisitions are executed and the image data stored on the onboard recorders. • The satellite is within range of a main receiving station (Kiruna or Toulouse). It can thus be programmed either to down-link image data in real-time or play back the onboard recorders and transmit image data recorded earlier during the same orbital revolution. • The rest of the time, the satellite is on standby ready to acquire imagery in accordance with uplinked commands.
Processing Steps • Once data has been transmitted, the SPOT images undergo preprocessing operations (for SPOT data, the term "processing" is used only in terms of data manipulations undertaken by end-users). • The data transmissions are demodulated, synchronized and simultaneously recorded onto two high-density data tapes (HDDTs). One of the HDDTs is used as an archive master while the other HDDT acts as a backup for the master tape.
Processing Steps • A SPOT satellite data-collection pass lasting approximately 10 minutes with a constant viewing configuration yields two data segments with each segment containing approximately 75 scenes. This yield represents use of either one HRV set to dual mode or use of both HRVs in single mode. The size of individual scenes varies.
Processing Steps The SPOT scenes are defined by the following additional preprocessing characteristics only when there have been user requests for the scenes: • Preprocessing level • Computer compatible tape (CCT) or film
Satellite Image Aquisition and Pre-processing • Two Landsat-TM images and one ERS-1 SAR scene were used in this study. These were already available within the JRC archive, as they have been used in a previous study within the EMAP Unit. As such, there were no costs involved, specific to this project, with regard to image acquisition and pre-processing.
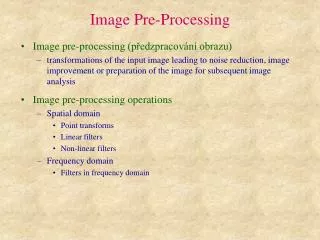
Image Pre-processing Preprocessing of satellite images prior to image classification and change detection is essential. Preprocessing commonly comprises a series of sequential operations, including atmospheric correction or normalization, image registration, geometric correction, and masking (e.g., for clouds, water, irrelevant features)
Image Pre-processing • The normalization of satellite imagery takes into account the combined, measurable reflectances of the atmosphere, aerosol scattering and absorption, and the earth’s surface. It is the volatility of the atmosphere which can introduce variation between the reflectance values or digital numbers (DN’s) of satellite images acquired at different times. Although the effects of the atmosphere upon remotely sensed data are not considered errors, since they are part of the signal received by the sensing device, consideration of these effects is important. The goal conveniently should be that following image preprocessing, all images should appear as if they were acquired from the same sensor.
Satellite image rectification • The goal of image rectification is to facilitate the overlay of additional imagery and other geographic data sets. A standard map area, with boundaries set in UTM, is established for each scene, thus all image files for the same region, once rectified, will occupy the same map area. The UTM bounds for the scene are established according to the file size, the 28.5 x 28.5 m pixels, and the minimum/maximum northing and easting required to contain the full scene area. These boundaries, the UTM zone and the ellipsoid are established on each newly- created empty file.
Geometric Rectification • Geometric rectification of the imagery resamples or changes the pixel grid to fit that of a map projection or another reference image. This becomes especially important when scene to scene comparisons of individual pixels in applications such as change detection are being sought.
Subset of Study Area • In some cases, Landsat TM scenes are much larger than a project study area. In these instances it is beneficial to reduce the size of the image file to include only the area of interest. This not only eliminates the extraneous data in the file, but it speeds up processing due to the smaller amount of data to process. This is important when utilizing multiband data such as Landsat TM imagery. This reduction of data is known as subsetting. This process cuts out the preferred study area from the image scene into a smaller more manageable file.
Subset of Study Area • A Landsat TM image is 115 miles (185 kilometers) wide by 106 miles (170kilometers) long and has a total area of 12,190 square miles or 31,450 square kilometers. • Carroll County has an area of approximately 641 square miles. In order to subset the study area from each of the four Landsat scenes, a vector file defining the county boundary with the same georeferenced coordinates as the Landsat images, UTM Zone 15, NAD27, was imported into PCI Imageworks. The county boundary vector file was converted to a binary bitmap mask and overlaid on to each of the TM scenes. The county mask acts as a virtual cookie-cutter and subsets the study area similar to the previous figure.
Preprocessing Procedure • Before the creation of the minimum images, preprocessing must occur. The pre-processing procedure consists of six steps: (1) collection; (2) downloading; (3) unzipping twice; (4) executing the preprocessing algorithms through the ENVI software; (5) checking the final preprocessed images, and (6) executing the patch procedure, where necessary.
Preprocessing Procedure Once this preprocessing procedure is complete, an image containing clouds, surface reflectance and aerosol reflectance is created
. Final preprocessing JPEG image consisting solely of clouds, surface reflectance and aerosol reflectance.
Image processing • Once the raw remote sensing digital data has been acquired, it is then processed into usable information. Analog film photographs are chemically processed in a darkroom whereas digital images are processed within a computer. Processing digital data involves changing the data to correct for certain types of distortions. Whenever data is changed to correct for one type of distortion, the possibility of the creating another type of distortion exists. The changes made to remote sensing data involve two major operations: preprocessing and postprocessing.
Preprocessing • The preprocessing steps of a remotely sensed image generally are performed before the postprocessing enhancement, extraction and analysis of information from the image. Typically, it will be the data provider who will preprocess the image data before delivery of the data to the customer or user. Preprocessing of image data often will include radiometric correction and geometric correction.
Radiometric corrections • Radiometric corrections are made to the raw digital image data to correct for brightness values, of the object on the ground, that have been distorted because of sensor calibration or sensor malfunction problems. The distortion of images is caused by the scattering of reflected electromagnetic light energy due to a constantly changing atmosphere. This is one source of sensor calibration error.
Geometric corrections • Geometric corrections are made to correct the inaccuracy between the location coordinates of the picture elements in the image data, and the actual location coordinates on the ground. Several types of geometric corrections include system, precision, and terrain corrections.
System correction uses a geographic reference point for a pixel element such as that provided by the global positioning system. Correction accuracy often varies depending upon the accuracy of the position given by the global positioning system. Aircraft platform system instability is shown in the first figure. Preprocessing correction removes the motion distortion as shown in second figure.
Data Processing, Interpretation and Analysis • Remote sensing data available in pictorial or digital form need to be interpreted to derive meaningful information. To interpret the remote sensing data, knowledge of the spectral reflectance signature of various objects on the earth is essential. The data can be interpreted either visually, digitally or both. Image interpretation and analysis is beyond the scope of this guide; here we focus on image processing, enhancement, georeferencing and categorization.
Data Processing, Interpretation and Analysis • Before images can be analyzed, some degree of pre-processing is necessary to correct for any distortion inherent in the images due to the characteristics of imaging system and conditions. Commonly used pre-processing procedures include: radiometric correction, geometric correction and atmospheric correction.
Data Processing, Interpretation and Analysis • Once pre-processing is completed, images can be enhanced to improve the visual appearance of the objects on the image. Commonly used image enhancement techniques include image reduction, image magnification; transect extraction, contrast adjustments, band ratioing, spatial filtering, Fourier transformations, principal components analysis, and texture transformation These are all used to extract useful information that assists in image interpretation.
Data Processing, Interpretation and Analysis • For both visual image interpretation and digital image processing, the availability of secondary data and knowledge of the analyst are extremely important. The visual interpretation can be done using various viewing and interpretation devices. Most commonly used elements of visual analysis are tone, color, size, shape, texture, pattern, height, shadow, site and association of the object under investigation. Digital image processing relies primarily on the radiance of image picture elements (pixels) for each band. Radiance is then translated into digital numbers (DNs), or gray scale intensity, for example from 0 (lowest intensity, or black) to 255 (highest intensity, or white). A DN for a specific band will indicate the intensity of the radiance at that wavelength.
Data Processing, Interpretation and Analysis • Georeferencing is the process of taking the image in its raw format (rows and columns of data) and linking it to the land that it covers. Images are georeferenced by linking spatially distributed control points in the satellite image to points on base maps or points referenced in the field through global positioning systems. The raster data in the image is thereby registered to a Cartesian coordinate system, and can be combined with other georeferenced data sets in a geographic information system.
Data Processing, Interpretation and Analysis • For many purposes, data that is collected from the earths surface, which represents a continuous variation, needs to be categorized. Pixels with similar spectral signatures are grouped together in a process known as image classification. Supervised classification entails telling the software what a certain pixel represents, such as boreal forest, and then having the computer classify every pixel with a similar spectral signature as boreal forest. To undertake supervised classification, it is necessary to collect training samples that relate ground cover to spectral signatures for a given geographic location. In unsupervised classification, the analyst specifies the desired number of classes, and the computer automatically sorts the pixels. For an example of supervised classification, see Figure in the next slide.
Data Processing, Interpretation and Analysis • The output of remote sensing data analysis can be presented in a variety of ways including a printout of the enhanced image itself, an image map, a thematic map (e.g. land use map), a spatial database, summary statistics and/or graphs. The output data can be integrated with a geographic information system (GIS) database for further analysis.
We start from scanned maps. Later this can be extended to satellite images.
The color channels are decomposed, but instead of RGB, CMY is used. From the components we use the yellow channel, beacuse it is easy to detect sea, which is blue, so having only a little yellow component.
In the last step the coastline is detected, using the following algorithms: -Box filtering -Robert's gradient -Tresholding