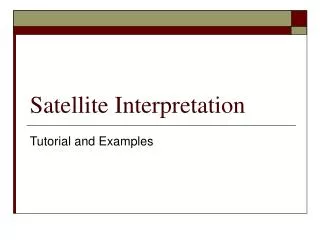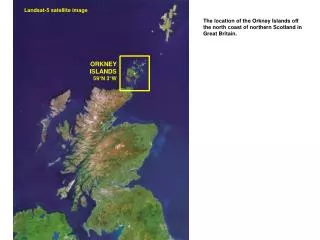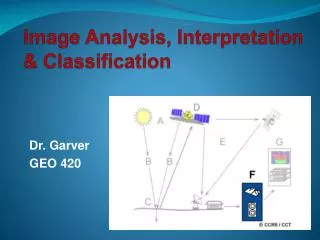
Satellite Image Interpretation
Satellite Image Interpretation. Mirza Muhammad Waqar Contact: mirza.waqar@ist.edu.pk +92-21-34650765-79 EXT:2257. RG610. Course: Introduction to RS & DIP. Contents. Geographical Information System Remote Sensing & Satellite Image Processing Color Space Landsat 7 spectral bands


Satellite Image Interpretation
E N D
Presentation Transcript
Satellite Image Interpretation Mirza Muhammad Waqar Contact: mirza.waqar@ist.edu.pk +92-21-34650765-79 EXT:2257 RG610 Course: Introduction to RS & DIP
Contents • Geographical Information System • Remote Sensing & Satellite Image Processing • Color Space • Landsat 7 spectral bands • Spectral Reflectance Curves • Image Interpretation • Spectral Ratioing • Indices
Geographical Information System (GIS) Data Methods Site Suitability Analysis Spatial Analysis 3D Analysis Hydrological Analysis Finding Shortest Path Finding Closest Facility Change Detection Software
Spectral vs Spatial • Spectral pattern recognition Family of classification procedures that utilize pixel by pixel spectral information as the basis for automated land cover classification. • Spatial pattern recognition Categorization of image pixels on the basis of their spatial relationship with pixels surrounding them.
Landscape visualization • The ground view • Field investigation and survey • Great details, sample taken and field measurements • High cost, time consuming, physically demanding • The bird-eye view • Natural observation, perspective view • Difficult for mapping and locationing • The orthographic view • Professional aerial survey and space mapping • High locational accuracy, fast coverage, economic • Lack of 3-dimensional information, skill demanding
The ground view Ground view of Mt. Everest, the highest spot on earth.
Visualization – Bird-Eye View Bird-eye view of Mt. Everest. The photo was taken by astronauts on the International Space Station.
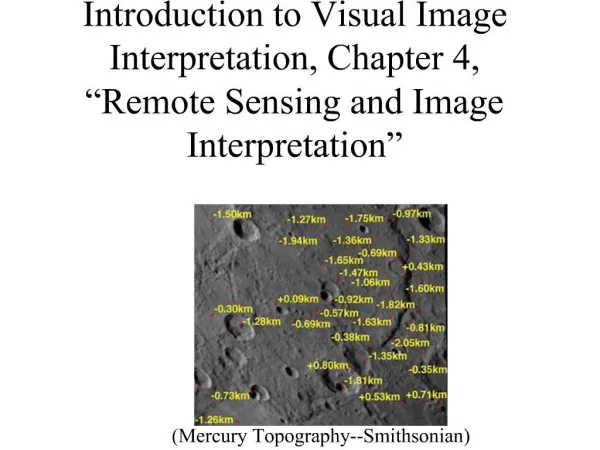
Visualization – Orthographic View Orthographic view of Mt. Everest. The photo was taken by astronauts on the International Space Station in 1993.
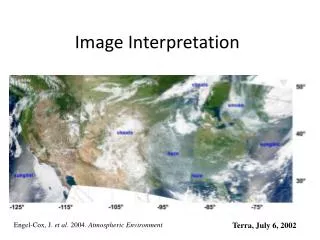
The concepts of image interpretation • Image interpretation: the process of identifying objects or conditions in images and determining their meaning or significance. • The interpreter’s task: use scientific tools and methodology to arrive at objective findings. • Geographical knowledge is needed to relate the visible characteristics on the image to the real-world geographical features, even though some of these features may not be physically visible.
Spatial interpretation • Spatial interpretation means identifying geographical features using spatial characteristics of objects shown on images. • The most important tasks for spatial interpretation is to establish interpretation keys, i.e. identifying the typical spatial and spectral patterns of known geographical features.
Obvious features Multi-runway airfield used by carrier-based pilots for practicing short takeoffs and landings (Broward County, Florida) Low-altitude photograph of the Pentagon Building, headquarters of the US Department of Defense
Keys for image interpretation • Shape • Size • Pattern • Shadow • Tone or colour • Texture • Association • Site
Shape Alluvial fans along the east side of Death Valley, California. Alluvial fans can be easily recognised by their fan shape and adjacency to mountain fronts. Some man-made features have unique shapes.
Pyramids Ground view of the Great Pyramids, Egypt.
Shape Alluvial fans at the north of Turpan Depression, Xinjiang, China. Centre-pivot irrigation system in Morrow County, Oregon. Most of the fields are planted with wheat.
A Centre-Pivot Irrigation System A centre-pivot irrigation system in Ili, Xinjiang, China.
An Alluvial fan Ground view of alluvial fans at the north of Turpan Depression, Xinjiang, China.
Size Panchromatic photo of Bangkok, 1982. Note the size of buildings tends to indicate the nature and usage of them.
Pattern The contrast between sand dunes (left) and loess (right) landscapes found near Yulin, Shannxi, northern China. The mobile sand dunes are well recognised by their repeated patterns, while the high density of gullies of the loess landscape suggests severe soil erosion and mass movement.
Natural Patterns The patterns of forest and wetland show significant variation on remotely sensed images.
Loess Landscape The high density of gullies is the key for image interpretation of the loess landscape.
Shadow Shadow shown with low sun angle is the key to the interpretation of shape of Mt. Everest.
Tone or Color Tone and colour are used to identify agricultural fields. The fields with crops or harvested are clearly separated by their tones and colours. Also note the tone difference shown on the bare fields indicating different soil moisture contents.
Texture Textures associated with forest, pasture and cropland. The colour photograph shows the strong contrast in texture between forest (dark and coarse), pasture (light and smooth and farmland (light and smooth with regular road and drainage network).
Association A chain of oasis is located along the toe of an alluvial fan in Turpan Depression, Xinjiang, China. There is a good supply of shallow groundwater to support irrigation system and human settlement in the extremely dry area.
Site Sea Port at Kowloon Peninsula of Hong Kong. The site is characterised by regular shore line and large concrete area of loading zones. The extensive transportation network also a good key to identify the port.
Spectral interpretation • The spatial interpretation keys are also employed to interpret multi-spectral images. • Scale • Spatial distortion • Multi-spectral images, however, add one more dimension (i.e. the spectral space) for image interpretation. • Understanding spectral signature is therefore mandatory for image interpretation.
Color Space Secondary Colors Primary Colors Magenta+ CyanBlue Yellow + CyanGreen Yellow + MagentaRed Red + BlueMagenta Green + BlueCyan Red + Green Yellow
Spectral Reflectance Curves of Different Land Covers Source: YasirYaqoob Wateen Telecom
Islamabad Capital Territory – Raw Image Band Combination RGB:542 Vegetation: R=38% G=48% B=17% Grey Tone=17% ----------------------- R=21% G=31% B=0% Yellow Tone= 21% ----------------------- R=0% G=10% B=0% Vegetation: Green Dominating Yellow Soil: ? Snow: ? Cloud: ? Water: ?