Image Interpretation
Image Interpretation. Color Composites. Engel-Cox, J. et al . 2004. Atmospheric Environment. Terra, July 6, 2002. Information Content.
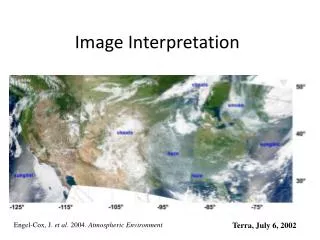

Image Interpretation
E N D
Presentation Transcript
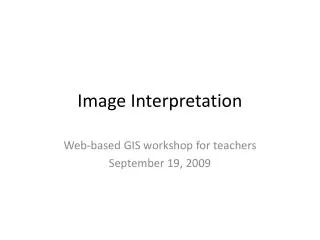
Image Interpretation Color Composites Engel-Cox, J. et al. 2004. Atmospheric Environment Terra, July 6, 2002
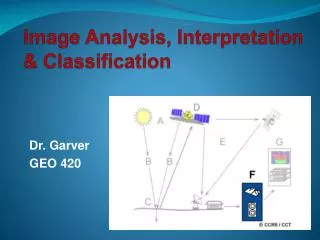
Information Content • While scientists are primarily interested in geophysical quantities such as pollution concentrations and temperatures – space-borne sensors only measure radiances • These radiances must be converted to geophysical quantities.
Image Interpretation – Level 1 Radiances are converted to reflectances
Image Interpretation – Level 1 Radiances are converted to temperature
Color Composite Yellow is a mix of red and green; orange is a mix of more red and some green; white is an equal mix of all three primaries, and black is simply the absence of any colored light of any wavelength
Spectral Signatures • Spectral signatures allow identification of classes (or features) • Example : Water does not reflect beyond ~0.8 micron
Imagery Color Composite Clouds are white Water is black, Vegetation is green. Visible imagery Clouds are white Water is black
Why is this important? • You can only understand spectral signatures from Level 1 imagery • This is the foundation for image classification, feature identification and understanding how to separate various classes. • Example : How does one separate aerosols from clouds or the background?
Image interpretation • 550 nm imagery shows smoke, clouds, ocean and land • Note that eye captures textural information as well
MODIS Wavelength (um) Spectral Signatures of Aerosols and Clouds Water Clouds MODIS Wavelength (um) In thermal IR smoke and Ocean temperatures are same sub micron smoke does not Emit at these wavelengths. Clouds have colder temperatures Smoke has sub micron size, therefore Not reflective at 2.1 um Water clouds at 2.1 um reflect based on particle sizeOcean reflects less than smoke at 0.55um
How to pick bands for Red, Green, Blue • Depends upon your image • Example R : 645 nm, G : 865 nm, B : 645 nm • Note that all of this is reflected solar radiation • Note that 865 nm reflectance is in both the Red and Green and Blue Bands • Since the green is at 865 nm if there is healthy green vegetation then then the color composite will show up as green for vegetation • Clouds are spectrally flat and reflect about the same in R, G, and B and therefore will be white
Fusing Level 1 and Level 2 • AOD is a measure of the extinction and scattering of light by particles in a total column from the satellite to the ground • AOD is proportional to particulate concentration • AOD is dimensionless; values typically range from 0 (clear, no haze) to 1 (very hazy, smoky, or dusty) in the US • Clouds block the measurement of AOD!
Next Steps • In the afternoon session you will be ‘playing’ with GLIDER to interpret level 1B imagery • You willbecreating this
Other examples from Volcanic Ash ASH R, G, B = 0.47,0.55,0.65 um R,G,B = 0.65, 2.13, 11.0 um