Download
1 / 23
240 likes | 395 Vues
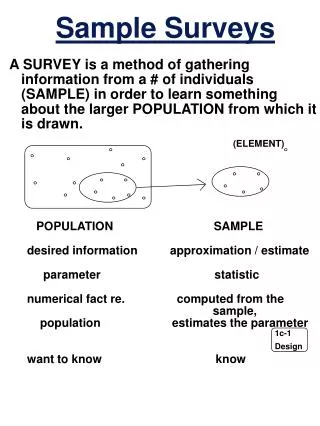
Regional forest maps by combination of sample surveys and satellite image interpretation. Tove Vaaje Norwegian Institute of Land Inventory Norsk institutt for jord- og skogkartlegging NIJOS. Regional forest maps. Needed for smaller regions Useful for: Area management Resource management

E N D
Regional forest maps by combination of sample surveys and satellite image interpretation Tove Vaaje Norwegian Institute of Land Inventory Norsk institutt for jord- og skogkartlegging NIJOS
Regional forest maps • Needed for smaller regions • Useful for: • Area management • Resource management • Area analyses • Business purposes • Etc.
Østfold Kommune A county southeast in Norway This area is used because of previous studies in the area
Data sources • DMK – digital land use maps • DEM – digital elevation model • NFI – National forest inventory • Satellite images
DMK • Digital land use maps(digitalt markslagskart) • Providesinformationaboutthe land capability
DEM • Digital elevation model • Can correct image values for the terrain effect • Can stratify the NFI sample plots in altitude zones
NFI • National forest inventory • Based on sample plots laid out in a regular grid with 3 kilometers distance between plots • Each inventory cycle is five years • The permanent plots are supplied with temporary plots
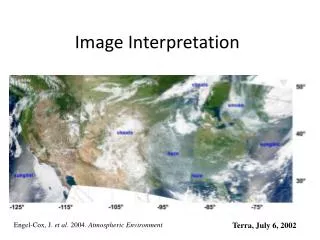
Satellite Images • Landsat TM images covering the reference area and the inventory area
Method • The method used is MSFI – Multi Source Forest Inventory • Based on three components: • A defined neighbourhood for each pixel • An algorithm that finds all the training pixels meeting the neighbourhood definition • A method to calculate an estimate based on the training pixels in the neighbourhood
MSFI • A fundamental assumption is that spectral similarity implies similarity in forest condition the success of the method relies on the correlation between the spectral and biotic variables
Previous project • The municipality of Hobøl northwest in Østfold county • Analysed the use of MSFI using more than 1000 sample plots • A program running MSFI was developed for the Norwegian forest
Results of previous project • 28 different forest attributes were estimated • Satisfactory results were obtained for: • Dominant tree species • Top height • Number of conifers • Total number of trees • Mean height of young forest
Use of data sources (1) • Satellite images • Used for the spectral analysis • A deviated cloud mask is used to remove NFI plots covered by clouds • DMK • Forest mask • Production potential of forest
Use of data sources (2) • All the image files need to have the same number of rows and columns, and the same pixel size • The pixels have to be adjusted to match each other. The satellite image is used as a snap grid
The MSFI program • The Norwegian MSFI program, developed by Arnt Kristian Gjertsen, is started with a run control file:
Segmentation (1) • Segmentation is performed to make more informative and usable maps • Sequences from SkoGIS++, seg.exe and zone2vec.exe,are used • A majority variable for each zone segment is selected
Segmentation (2) Not segmented: Segmented:
Distribution • To get more information about the data, a frequency commando can be used for the wanted attributes Specific distribution of a certainmaturity class can easily be presented
Results (2) • Comparison with the NFI statistics for some of the attributes:
Results (3) • Maturity classes, as presented, do not give a satisfying result. A new classification has to be introduced:
Improvementof MSFI • Issues which need to be solved in a new version of the MSFI-program: • Areas covered with clouds are classfied in the inventory area. These pixels need to be marked as clouds, and not be classified • NoData areas in the rasterdata have the value 0. This makes it possible to choose a NoData area as nearest neighbour • Areas with high altitude differences is not corrected using the DEM data