Download
1 / 42
420 likes | 526 Vues
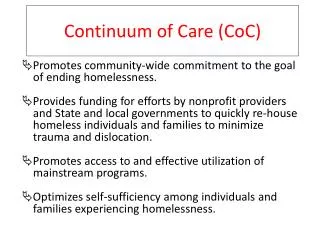
Brown County Continuum of Care Status Report. Report Motivation. Updates on previous status reports Where are we compared to where we were last year? Are we moving in the right direction?. 2013 Recommendations. Reduce Average Length of Stay Target Services to High-Barrier Clients

E N D
Report Motivation • Updates on previous status reports • Where are we compared to where we were last year? • Are we moving in the right direction?
2013 Recommendations • Reduce Average Length of Stay • Target Services to High-Barrier Clients • Divert Low-Barrier Clients to Rapid Re-Housing • Transitional Housing: Increase Client Retention Rates
Presentation Outline • 2013 (Point-In-Time and Clients Served) • Client Risk Scores • Length of Stay • Transitional Housing Retention and Completion Rates • Recidivism Rates
Point In Time Count Emergency Shelter
Point In Time Count Transitional Households
What is a Risk Score? • Measure to estimate difficulty of serving a client • Calculation based on particular client characteristics • No Income (past 30 days) • From Streets • Chronically Homeless • AODA • Mental Illness
Purpose • Help level the playing field between providers • Analyze program success/failure rates with respect to demographics of clients served • Allows for a more standardized side-by-side program comparison • Encourages programs to serve high-barrier clients
Sarah No Income in past 30 days? If YES: +1 X Client Risk Score If YES: +1 Mental Illness? √ If BOTH YES: +3 Alcohol or drug abuse? If YES: +1 X If YES: +1 Chronically Homeless? √ Range: 0 - 6 If YES: +1 1 0 2 Coming from Streets? X
Provider Risk Score RP = 1·c1+2·c2+3·c3+4·c4+6·c5+7·c6c1+c2+c3+c4+c5+c6 Provider Risk Score Clients Assigned Risk Score Risk Score Calculation 3 1 2 0 4 6 5
Emergency Shelter Risk Scores Average: 37
Transitional Housing Risk Scores 2013 Average: 30 2012 Average: 28
Length of Stay (Emergency Shelters) • Aim: Shelter Stays of 30 days or less • High Performing Communities (HUD) • Average length of stay of 20 days or less • OR >10% decrease in average length of stay • Brown CoC average in 2012: 52.8 days
Length of Stay (in days) HUD Goal
Transitional Housing Completers Average Length of Stay (in months) 2012 Average: 12 months2013 Average: 11 months 2012 2013
% Exiters Completing Program 2013 Average: 66% 2012 Average: 63%
% Left Due To Disagreement/ Program Non-Compliance 2012 Average: 12%2013 Average: 13%
2013 Average: 24% s2012 Average: 23%
Recidivism Rates from Transitional Housing to Emergency Shelter (w/in 6 months of exit) 2012 Average: 8% 2013 Average: 3%
2012 Average: 11% 2013 Average: 5%
Green Bay Client CountOctober 1, 2011 – September 30, 2013 St. John the Evangelist Homeless Shelter Total Clients:2,557
Emergency Shelter: What’s Working • Average length of shelter stay is decreasing • Recidivism rates are not increasing (Shorter shelter stays still as effective) • The majority of clients served in Brown County shelters are from Brown County
Emergency Shelter: Suggestions • Continue to aim for shorter (20-30 day) shelter stays • Consider ways to reduce recidivism among clients (e.g. offering additional/alternate services, partnering with other organizations, pursuing coordinated assessment for effective placements)
Transitional Housing: What’s Working • Many programs increased client completion rates (2013 average: 66.3%) • Clients who complete programs are successfully moving to housing • Transitional-to-Transitional recidivism rate reduced significantly since 2012 (11% to 5%)
Transitional Housing: Suggestions • Divert low-barrier clients to rapid re-housing • Reduce high number of exits due to program non-compliance/ disagreement with staff (program-specific) • Consider ways to reduce recidivism rates (program-specific)
Revisit 2012 Recommendations • Reduce Average Length of Stay • Target Services to High-Barrier Clients • Divert Low-Barrier Clients to Rapid Re-Housing • Transitional Housing: Increase Client Retention Rates
Questions? jesse.dirkman@icalliances.orgjennifer.allen@icalliances.org