Download
1 / 10
110 likes | 217 Vues
This programming example demonstrates using logistic regression to predict task completion based on programming experience. The code includes data input, sorting, scatterplot with smoothing, logistic regression modeling, and hypothesis testing. By analyzing the relationship between experience and task completion, it showcases the application of statistical methods in programming tasks. The example provides insight into how programming experience, measured in months, influences completion outcomes. The demonstration aims to enhance understanding of applying statistical techniques in programming scenarios.

E N D
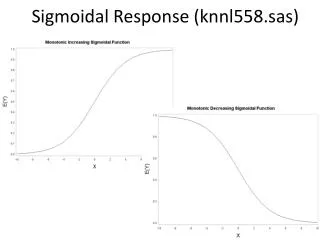
Programming Example: knnl565.sas Y = completion of a programming task (1 = yes, 0 = no) X2 = amount of programming experience (months) n = 25
Programming Example: input data programming; infile‘H:\My Documents\Stat 512\CH14TA01.DAT'; input experience complete; procprintdata=programming; run;
Programming Example: Scatterplot procsortdata=programming; by experience; title1'scatterplot with smoothing'; symbol1v=square i=sm60 c=blue; procgplotdata=programming; plot complete*experience; run;
Programming Experience: Logistic Regression procgenmoddata=programming descending; model complete = experience/dist=binomial link=logittype1 aggregate; run;
Programming Experience: Logistic Regression (cont) PROC GENMOD is modeling the probability that complete='1'.
Programming Example: Fitted Curve symbol1v=square i=nonec=blue; symbol2v=nonei=join c=blue; procgplotdata=fit; plot complete*experience pred*experience/overlay; run;