Download
1 / 11
110 likes | 241 Vues
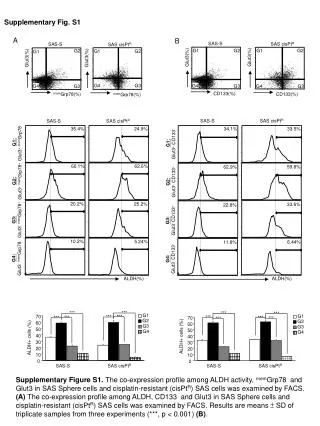
This study investigates the co-expression profiles among ALDH activity, Glut3, and MemGrp78 in SAS Sphere cells and their cisplatin-resistant counterparts (cisPtR). Using FACS analysis, we assessed the expression levels within different cell populations (G1, G2, G3, G4) to understand the relationship between these markers and their impact on drug resistance. Statistical significance is noted (p < 0.001) across triplicates, indicating that specific expression patterns may elucidate pathways influencing chemoresistance in cancer treatments.

E N D
Supplementary Fig. S1 A B SAS-S SAS cisPtR SAS-S SAS cisPtR G2 G1 Glut3(%) Glut3(%) Glut3(%) Glut3(%) G2 G1 G1 G2 G4 G3 CD133(%) CD133(%) memGrp78(%) memGrp78(%) G1 G2 SAS cisPtR SAS-S SAS cisPtR SAS-S G1: Glut3+memGrp78- G1: Glut3+CD133- 60.1% 24.9% 33.5% 35.4% G2: Glut3+memGrp78+ G2: Glut3+CD133+ 20.2% 10.2% 62.6% 59.8% G3: Glut3-memGrp78+ G3: Glut3- CD133+ 34.1% 11.8% 62.9% 25.2% 33.6% 22.8% G4: Glut3-memGrp78- G4: Glut3- CD133- 5.24% G4 G3 G4 6.44% G3 ALDH(%) ALDH(%) G4 G3 G1 G1 G2 G2 *** *** *** *** *** *** G3 G3 *** *** *** *** *** *** 70 70 G4 G4 60 60 50 50 ALDH+ cells (%) 40 ALDH+ cells (%) 40 30 30 20 20 10 10 0 0 SAS cisPtR SAS-S SAS cisPtR SAS-S Supplementary Figure S1. The co-expression profile among ALDH activity, memGrp78 and Glut3 in SAS Sphere cells and cisplatin-resistant (cisPtR) SAS cells was examined by FACS. (A)The co-expression profile among ALDH, CD133 and Glut3 in SAS Sphere cells and cisplatin-resistant (cisPtR) SAS cells was examined by FACS. Results are means ± SD of triplicate samples from three experiments (***, p < 0.001) (B).
Supplementary data Supplementary Fig. S2 A SAS-P SAS-S Count 4.3% 0.7% CellROXDeep Red 0.3% 15.7% Count 15.7% Count 0.7% CellROX Deep Red B DCF+ SAS-P SAS-P SAS-S SAS-S Count DCF+ • Supplementary Figure S2. Single-cell suspension from parental SASor sphere SAScells was stained with (A) CellROX Deep Red reagentand (B) DCF (oxidation-insensitiveanalog). Then, the intracellular level of ROS in parental SASor sphere SAS cells was determined by FACS analyses.
Supplementary data Supplementary Fig. S3 A SAS-P Recover 20 days Recover 30 days cisPt 10 µM 72hr cis-PtR cisPt 10 µM 72hr Recover 20 days Supplementary Figure S3. Enrichment of the drug-resistant population after in vitro drug treatment. Image of enrichment of the cisplatin-resistant population cells. Treatment of 5µMcisplatin killed more than 50% of cells at 48 h. The majority of cells died by the fifth day. Over the next 20 days few enlarged cells were seen with flattened, senescent-like morphology. Then the supernatant were replaced with fresh medium containing drugs at 48hr. After two more cycles, sphere cells were seen. cisPt, cisplatin.
Supplementary data Supplementary Fig. S4 A ROSLow H2O2 Arsenic control B SAS-S ROSLow ROSMedi ROSLow ROSMedi ROSHigh ROSHigh %Sphere-formation efficiency *** *** 60 50 40 30 20 10 0 Supplementary Figure S4.ROSLowcells were sorted using DCFDA staining from SAS sphere cells. At day 21, the cells were treated with H2O2 or arsenic,respectively,for 72 hours. Representative images of chemical induced differentiation were shown. (A)A single cell of ROSLow, ROSMediand ROSHighunder defined serum-free selection medium was plated in each well of 96-well low attachment plates, respectively. After 14 days, counted the number of spheres and calculated the sphere-forming efficiency (B).
Supplementary data Supplementary Fig. S5 A OECM1-P SAS-Sphere OECM1-Sphere SAS-P PRDX3 CAT SOD2 3 weeks 5 weeks 9 weeks 3 weeks 5 weeks 9 weeks Parental Parental Supplementary Figure S5. Differentially expressed genes of reactive oxygen species scavenging in Parental cells and Sphere cells under 2, 3, 5, or 9 weeks of cultivation with defined serum-free selection medium were collected and analyzed. (A) The heat maps of some ROS scavenger genes in parental versus sphere cells. Red and blue indicate high and low expression levels, respectively. SAS-P, SAS parental; OECM1-P, OECM1 parental; SAS-S, SAS Sphere; OECM1-S, OECM1 Sphere; CAT, catalase; PRDX3, peroxiredoxin 3; SOD2, superoxide dismutase 2.
Supplementary data Supplementary Fig. S6 B A 0.35 0.3 0.18 OECM1-P SAS-P 0.16 0.25 OECM1-S SAS-S 0.14 OECM1-S 3AT SAS-S 3AT 0.2 0.12 Catalasespecific activity Catalasespecific activity 0.1 0.15 0.08 0.06 0.1 0.04 0.05 0.02 0 0 Supplementary Figure S6. Treatment of sphere cells with catalase inhibitor 3AT reduced catalase activity. (A) SAS-S cells or (B) OECM1-S cells were pretreated with catalase inhibitor (3AT), for 72hr, afterward, we measured the activities of catalase as described in Materials and Methods.
Supplementary data Supplementary Fig. S7 B A SAS-S SAS-S cisPt cisPt Control Control 14.9% 4.2% 74.0% 7.0% 2ME +cisPt 2ME + cisPt 2ME 2ME 10.0% 42.9% 21.8% 5.7% 3.5% 8.1% 56.3% 5.6% 20.8% 2ME+3AT+cisPt 3AT + cisPt 3AT 3AT + cisPt 3AT 13.0% 5.3% 17.3% Count 5.6 12.8% Propidium iodide(PI)+ CK18+ cells (%) 67.6% 9.7% 8.3% 18.2% 6.4% 3AT + 2ME + cisPt 3AT + 2ME + cisPt 1.5% Count 7.6% 35.2% AnnexinV DCFDA 6.8% 84.1% 60.5% Control CisPt C 11.9% 76.0% 4.3% 13.1% 68.5% Supplementary Figure S7. Combinatorial treatment of ROS scavenger inhibitor and cisplatin induces apoptosis cell death. (A) SAS-Sphere cells were either singly treated with cisplatin or co-treated with ROS scavenger (2ME and 3AT), for 72hr, afterward, and stained with DCFDA plus (B) Annexin V/Propidium iodide (PI); then, examined by flow cytometry. (C) The amount of CK18 positive cells was determined by staining the drugs treated cells with CK18 antibody, and then examined by flow cytometry (2ME: superoxide dismutase 2; 3AT: 3-Amino-1,2,4-triazole). 5.6% 7.0%
Supplementary data 32.9% Supplementary Fig. S8 B 45.9% A 20 40 18 35 16 28.0% 30 shLuc shLuc shLuc 14 25 12 shCAT#1 shCAT#1 shCAT#1 Ck18 cells (%) ROSLow cells (%) 10 20 shCAT#2 shCAT#2 shCAT#2 25.7% 33.5% 8 15 shSOD2#1 shSOD2#1 shSOD2#1 6 10 shSOD2#2 shSOD2#2 shSOD2#2 4 5 2 0 0 SAS-S SAS-S C shCAT#2 shLuc shCAT#1 shSOD2#2 shSOD2#1 CD44 cells (%) Count CD44(%) D SAS-S E SAS-S 70 60 shLuc shLuc 50 shCAT shCAT shLuc 50 45 shLuc Sphere No shSOD2 shSOD2 40 40 Colony No 35 30 30 20 25 10 20 15 0 10 shCAT shCAT 30 5 25 0 SAS-S 20 15 10 shSOD2 shSOD2 5 0 Supplementary Figure S8. Knockdown of CAT or SOD2 gene expression diminished spheres-forming capability, stemness marker expression of HN-CICs. The percentages of (A) ROS- cells, (B) CK18+ cells and (C) CD44+ cells in shCAT, shSOD2 and vector control SAS sphere cells were compared by flowcytometry analysis, respectively. SAS sphere cells were first infected with sh-CAT-1, sh-CAT-2, sh-SOD2-1, sh-SOD2-2 or sh-Luc lentivirus, and further cultivated under defined serum-free selection medium. The sphere formation capability (D) and anchorage independent growth ability (E) of SAS sphere cells treated with either sh-Luc or CAT or SOD2-shRNA lentivirus were examined by microscope.
Supplementary data Supplementary Fig. S9 B A 30 *** 25 20 24.6% ROSLow cells (%) Catalasespecific activity 15 10 43.8% 54.8% 5 0 SAS-S OECM1-S SAS-S SAS-S PEG-Control PEG-CAT * 0.45 C SSC 0.4 *** *** 0.35 SAS-S 25 0.3 PEG-Control PEG-CAT 20 0.25 SSC 0.2 15 memGrp78 cells (%) 0.15 16.3% 0.1 10 ROS(%) 0.05 5 0 PEG-Control PEG-Control PEG-Control 0 SAS-S PEG-CAT PEG-CAT PEG-CAT memGrp78(%) D 16.8% 22.3% SAS-S 3AT SAS-S PEG-CAT SAS-S 41.9% OECM1-S 3AT OECM1-S PEG-CAT OECM1-S 47.8% 60.6% Count 29.6% CD44(%) Supplementary Figure S9. Overexpression of CAT in HNCICs promotes stemness properties. (A) SAS-S cells or OECM1-S cells were treated with PEG-CAT (100 U/ml) , for 72hr, afterward, the intracellular catalase activities were measured . The percentages of (B) ROS- cells, (C) memGrp78+cells and (D) CD44+ cells in treated with PEG-CAT (100 U/ml) or control SAS sphere cells were analyzed by flow cytometry, respectively. (***, p<0.001)
Supplementary data Supplementary Fig. S10 A OECM1-P PEG-CAT PEG-Control PEG-CAT *** 45 SAS-P PEG-Control 40 SAS-P PEG-CAT *** 12.0% 30.3% 35 17.2% 37.8% 30 ALDH cells (%) 25 20 15 10 5 0 SAS-P OECM1-P OECM1-P PEG-Control Count ALDH(%) Supplementary Figure S10. Overexpression of CAT in HNSCCunder defined serum-free selection mediumpromotes stemness properties. The activity of ALDH in SAS cells treated with PEG-CAT (100 U/ml) or control PEG under further cultivation within defined serum-free medium for 4 days was analyzed by flow cytometry.(***, p<0.001)
Supplementary data Supplementary Fig. S11 A *** 120 Control *** 100 cisPt 5 µM 120 *** Control 120 Control 80 100 Cell Viability (%) 3AT 25 mM 100 2ME 15 µM 60 80 Cell Viability (%) Cell Viability (%) 80 40 60 60 20 40 40 0 20 HSC 20 0 HSC 0 HSC Supplementary Figure S11. Cell viability of drugs treated hematopoietic stem cells. (A) Hematopoietic stem cells (HSC) were treated with 5 µM cisplatin, 15 mM 2ME or 25 µM 3AT, respectively, for 72 hours. Cell viability of the treated cells was further determined by MTT assay. HSC, Hematopoietic stem cells.


![[Fig. S1]](https://cdn3.slideserve.com/6448662/slide1-dt.jpg)

