Methylation-Sensitive Restriction Digestion and AP-PCR Data in B6C3F1 and C57BL/6 Mice
250 likes | 371 Vues
This study presents individual animal data for methylation-sensitive restriction digestion followed by arbitrarily-primed PCR (AP-PCR) in B6C3F1 and C57BL/6 mice across control and 0.05% PB treatment groups. Data is shown for 2-week and 4-week time points using RsaI/HpaII and RsaI/MspI digestion methods. The results include the size and amount of PCR products, with different colors representing individual animals, and statistical averages from duplicate AP-PCR reactions. This research contributes to understanding methylation patterns in response to treatments.

Methylation-Sensitive Restriction Digestion and AP-PCR Data in B6C3F1 and C57BL/6 Mice
E N D
Presentation Transcript
Supplementary Fig. S1 Individual Animal Data for Methylation- Sensitive Restriction Digestion, followed by Arbitrarily-Primed PCR (AP-PCR) and Capillary Eletrophoresis, for B6C3F1 and C57BL/6 Mice, 2 and 4 Week Control and 0.05% (w/w) PB Treatment Groups
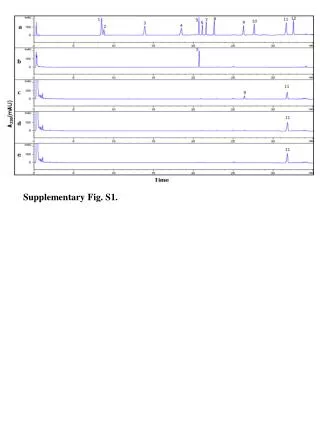
RsaI/HpaII Digest: B6C3F1, 2 Week Control Individual Animal Data Supplementary Figure S2. Individual animal data for the B6C3F1, 2 week control group (n = 6) after RsaI/HpaII digestion, followed by arbitrarily-primed PCR (AP-PCR) and capillary electrophoresis, are shown. The X-axis represents the size of the PCR products that formed, and the Y-axis represents the amount of each PCR product. Each color represents a different animal within the group, and each dot represents the average of 2 duplicate AP-PCR reactions.
RsaI/HpaII Digest: B6C3F1, 2 Week 0.05% PB-treated Individual Animal Data Supplementary Figure S3. Individual animal data for the B6C3F1, 2 week 0.05% PB-treated group (n = 6) after RsaI/HpaII digestion, followed by arbitrarily-primed PCR (AP-PCR) and capillary electrophoresis, are shown. The X-axis represents the size of the PCR products that formed, and the Y-axis represents the amount of each PCR product. Each color represents a different animal within the group, and each dot represents the average of 2 duplicate AP-PCR reactions.
RsaI/HpaII Digest: C57BL/6, 2 Week Control Individual Animal Data Supplementary Figure S4. Individual animal data for the C57BL/6, 2 week control group (n = 7) after RsaI/HpaII digestion, followed by arbitrarily-primed PCR (AP-PCR) and capillary electrophoresis, are shown. The X-axis represents the size of the PCR products that formed, and the Y-axis represents the amount of each PCR product. Each color represents a different animal within the group, and each dot represents the average of 2 duplicate AP-PCR reactions.
RsaI/HpaII Digest: C57BL/6, 2 Week 0.05% PB-treated Individual Animal Data Supplementary Figure S5. Individual animal data for the C57BL/6, 2 week 0.05% PB-treated group (n = 6) after RsaI/HpaII digestion, followed by arbitrarily-primed PCR (AP-PCR) and capillary electrophoresis, are shown. The X-axis represents the size of the PCR products that formed, and the Y-axis represents the amount of each PCR product. Each color represents a different animal within the group, and each dot represents the average of 2 duplicate AP-PCR reactions.
RsaI/HpaII Digest: B6C3F1, 4 Week Control Individual Animal Data Supplementary Figure S6. Individual animal data for the B6C3F1, 4 week control group (n = 7) after RsaI/HpaII digestion, followed by arbitrarily-primed PCR (AP-PCR) and capillary electrophoresis, are shown. The X-axis represents the size of the PCR products that formed, and the Y-axis represents the amount of each PCR product. Each color represents a different animal within the group, and each dot represents the average of 2 duplicate AP-PCR reactions.
RsaI/HpaII Digest: B6C3F1, 4 Week 0.05% PB-treated Individual Animal Data Supplementary Figure S7. Individual animal data for the B6C3F1, 4 week 0.05% PB-treated group (n = 6) after RsaI/HpaII digestion, followed by arbitrarily-primed PCR (AP-PCR) and capillary electrophoresis, are shown. The X-axis represents the size of the PCR products that formed, and the Y-axis represents the amount of each PCR product. Each color represents a different animal within the group, and each dot represents the average of 2 duplicate AP-PCR reactions.
RsaI/HpaII Digest: C57BL/6, 4 Week Control Individual Animal Data Supplementary Figure S8. Individual animal data for the C57BL/6, 4 week control group (n = 7) after RsaI/HpaII digestion, followed by arbitrarily-primed PCR (AP-PCR) and capillary electrophoresis, are shown. The X-axis represents the size of the PCR products that formed, and the Y-axis represents the amount of each PCR product. Each color represents a different animal within the group, and each dot represents the average of 2 duplicate AP-PCR reactions.
RsaI/HpaII Digest: C57BL/6, 4 Week 0.05% PB-treated Individual Animal Data Supplementary Figure S9. Individual animal data for the C57BL/6, 4 week 0.05% PB-treated group (n = 6) after RsaI/HpaII digestion, followed by arbitrarily-primed PCR (AP-PCR) and capillary electrophoresis, are shown. The X-axis represents the size of the PCR products that formed, and the Y-axis represents the amount of each PCR product. Each color represents a different animal within the group, and each dot represents the average of 2 duplicate AP-PCR reactions.
RsaI/MspI Digest: B6C3F1, 2 Week Control Individual Animal Data Supplementary Figure S10. Individual animal data for the B6C3F1, 2 week control group (n = 6) after RsaI/MspI digestion, followed by arbitrarily-primed PCR (AP-PCR) and capillary electrophoresis, are shown. The X-axis represents the size of the PCR products that formed, and the Y-axis represents the amount of each PCR product. Each color represents a different animal within the group, and each dot represents the average of 2 duplicate AP-PCR reactions.
RsaI/MspI Digest: B6C3F1, 2 Week 0.05% PB-treated Individual Animal Data Supplementary Figure S11. Individual animal data for the B6C3F1, 2 week 0.05% PB-treated group (n = 6) after RsaI/MspI digestion, followed by arbitrarily-primed PCR (AP-PCR) and capillary electrophoresis, are shown. The X-axis represents the size of the PCR products that formed, and the Y-axis represents the amount of each PCR product. Each color represents a different animal within the group, and each dot represents the average of 2 duplicate AP-PCR reactions.
RsaI/MspI Digest: C57BL/6, 2 Week Control Individual Animal Data Supplementary Figure S12. Individual animal data for the C57BL/6, 2 week control group (n = 7) after RsaI/MspI digestion, followed by arbitrarily-primed PCR (AP-PCR) and capillary electrophoresis, are shown. The X-axis represents the size of the PCR products that formed, and the Y-axis represents the amount of each PCR product. Each color represents a different animal within the group, and each dot represents the average of 2 duplicate AP-PCR reactions.
RsaI/MspI Digest: C57BL/6, 2 Week 0.05% PB-treated Individual Animal Data Supplementary Figure S13. Individual animal data for the C57BL/6, 2 week 0.05% PB-treated group (n = 6) after RsaI/MspI digestion, followed by arbitrarily-primed PCR (AP-PCR) and capillary electrophoresis, are shown. The X-axis represents the size of the PCR products that formed, and the Y-axis represents the amount of each PCR product. Each color represents a different animal within the group, and each dot represents the average of 2 duplicate AP-PCR reactions.
RsaI/MspI Digest: B6C3F1, 4 Week Control Individual Animal Data Supplementary Figure S14. Individual animal data for the B6C3F1, 4 week control group (n = 7) after RsaI/MspI digestion, followed by arbitrarily-primed PCR (AP-PCR) and capillary electrophoresis, are shown. The X-axis represents the size of the PCR products that formed, and the Y-axis represents the amount of each PCR product. Each color represents a different animal within the group, and each dot represents the average of 2 duplicate AP-PCR reactions.
RsaI/MspIDigest: B6C3F1, 4 Week 0.05% PB-treated Individual Animal Data Supplementary Figure S15. Individual animal data for the B6C3F1, 4 week 0.05% PB-treated group (n = 6) after RsaI/MspI digestion, followed by arbitrarily-primed PCR (AP-PCR) and capillary electrophoresis, are shown. The X-axis represents the size of the PCR products that formed, and the Y-axis represents the amount of each PCR product. Each color represents a different animal within the group, and each dot represents the average of 2 duplicate AP-PCR reactions.
RsaI/MspIDigest: C57BL/6, 4 Week Control Individual Animal Data Supplementary Figure S16. Individual animal data for the C57BL/6, 4 week control group (n = 7) after RsaI/MspI digestion, followed by arbitrarily-primed PCR (AP-PCR) and capillary electrophoresis, are shown. The X-axis represents the size of the PCR products that formed, and the Y-axis represents the amount of each PCR product. Each color represents a different animal within the group, and each dot represents the average of 2 duplicate AP-PCR reactions.
RsaI/MspI Digest: C57BL/6, 4 Week 0.05% PB-treated Individual Animal Data Supplementary Figure S17. Individual animal data for the C57BL/6, 4 week 0.05% PB-treated group (n = 6) after RsaI/MspI digestion, followed by arbitrarily-primed PCR (AP-PCR) and capillary electrophoresis, are shown. The X-axis represents the size of the PCR products that formed, and the Y-axis represents the amount of each PCR product. Each color represents a different animal within the group, and each dot represents the average of 2 duplicate AP-PCR reactions.
BfaI/BssHIIDigest: B6C3F1, 2 Week Control Individual Animal Data Supplementary Figure S18. Individual animal data for the B6C3F1, 2 week control group (n = 6) after BfaI/BssHII digestion, followed by arbitrarily-primed PCR (AP-PCR) and capillary electrophoresis, are shown. The X-axis represents the size of the PCR products that formed, and the Y-axis represents the amount of each PCR product. Each color represents a different animal within the group, and each dot represents the average of 2 duplicate AP-PCR reactions.
BfaI/BssHIIDigest: B6C3F1, 2 Week 0.05% PB-treated Individual Animal Data Supplementary Figure S19. Individual animal data for the B6C3F1, 2 week 0.05% PB-treated group (n = 6) after BfaI/BssHII digestion, followed by arbitrarily-primed PCR (AP-PCR) and capillary electrophoresis, are shown. The X-axis represents the size of the PCR products that formed, and the Y-axis represents the amount of each PCR product. Each color represents a different animal within the group, and each dot represents the average of 2 duplicate AP-PCR reactions.
BfaI/BssHIIDigest: C57BL/6, 2 Week Control Individual Animal Data Supplementary Figure S20. Individual animal data for the C57BL/6, 2 week control group (n = 7) after BfaI/BssHII digestion, followed by arbitrarily-primed PCR (AP-PCR) and capillary electrophoresis, are shown. The X-axis represents the size of the PCR products that formed, and the Y-axis represents the amount of each PCR product. Each color represents a different animal within the group, and each dot represents the average of 2 duplicate AP-PCR reactions.
BfaI/BssHII Digest: C57BL/6, 2 Week 0.05% PB-treated Individual Animal Data Supplementary Figure S21. Individual animal data for the C57BL/6, 2 week 0.05% PB-treated group (n = 6) after BfaI/BssHII digestion, followed by arbitrarily-primed PCR (AP-PCR) and capillary electrophoresis, are shown. The X-axis represents the size of the PCR products that formed, and the Y-axis represents the amount of each PCR product. Each color represents a different animal within the group, and each dot represents the average of 2 duplicate AP-PCR reactions.
BfaI/BssHIIDigest: B6C3F1, 4 Week Control Individual Animal Data Supplementary Figure S22. Individual animal data for the B6C3F1, 4 week control group (n = 7) after BfaI/BssHII digestion, followed by arbitrarily-primed PCR (AP-PCR) and capillary electrophoresis, are shown. The X-axis represents the size of the PCR products that formed, and the Y-axis represents the amount of each PCR product. Each color represents a different animal within the group, and each dot represents the average of 2 duplicate AP-PCR reactions.
BfaI/BssHII Digest: B6C3F1, 4 Week 0.05% PB-treated Individual Animal Data Supplementary Figure S23. Individual animal data for the B6C3F1, 4 week 0.05% PB-treated group (n = 6) after BfaI/BssHII digestion, followed by arbitrarily-primed PCR (AP-PCR) and capillary electrophoresis, are shown. The X-axis represents the size of the PCR products that formed, and the Y-axis represents the amount of each PCR product. Each color represents a different animal within the group, and each dot represents the average of 2 duplicate AP-PCR reactions.
BfaI/BssHIIDigest: C57BL/6, 4 Week Control Individual Animal Data Supplementary Figure S24. Individual animal data for the C57BL/6, 4 week control group (n = 7) after BfaI/BssHII digestion, followed by arbitrarily-primed PCR (AP-PCR) and capillary electrophoresis, are shown. The X-axis represents the size of the PCR products that formed, and the Y-axis represents the amount of each PCR product. Each color represents a different animal within the group, and each dot represents the average of 2 duplicate AP-PCR reactions.
BfaI/BssHII Digest: C57BL/6, 4 Week 0.05% PB-treated Individual Animal Data Supplementary Figure S25. Individual animal data for the C57BL/6, 4 week 0.05% PB-treated group (n = 6) after BfaI/BssHII digestion, followed by arbitrarily-primed PCR (AP-PCR) and capillary electrophoresis, are shown. The X-axis represents the size of the PCR products that formed, and the Y-axis represents the amount of each PCR product. Each color represents a different animal within the group, and each dot represents the average of 2 duplicate AP-PCR reactions.


![[Fig. S1]](https://cdn3.slideserve.com/6448662/slide1-dt.jpg)

