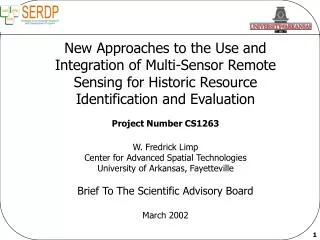
Integrating Behavioral and Landscape Approaches for Habitat Connectivity and Land Acquisition
This project aims to enhance land acquisition strategies for conservation by identifying critical habitats for at-risk species. Led by experts in landscape ecology and population modeling from universities in North Carolina, the initiative focuses on assessing habitat connectivity around military bases, specifically Ft. Bragg. By integrating behavioral insights and advanced spatial modeling techniques, the research seeks to develop decision support tools that prioritize land parcels for conservation in light of diverse species needs and land use pressures, ensuring effective habitat protection.

Integrating Behavioral and Landscape Approaches for Habitat Connectivity and Land Acquisition
E N D
Presentation Transcript
Performers Dr. Aaron Moody University of North Carolina, Chapel Hill Specialist in Landscape Ecology, Remote Sensing, GIS Dr. Nick Haddad North Carolina State University Specialist in Landscape Ecology and Conservation Biology Dr. Bill Morris Duke University Specialist in Population Ecology, Dispersal Modeling Dr. Jeffrey Walters Virginia Tech Specialist in Avian and Population Ecology Dr. Larry Crowder & Mr. Jeffery Priddy Duke University Specialist in Demographic Modeling
Problem Statement • Two strategies drive land acquisition: Conservation of high quality required habitats • Conservation of dispersal habitats • Which land parcels to conserve to meet needs of different species in context of military and non-military land uses?
Technical Objectives • Spatial decision support for land acquisition • • Behavioral and landscape approaches • • Habitat connectivity • • Multiple at-risk species
Technical Background Landscape Connectivity
Landscape Connectivity Our goal is to identify land units that provide the greatest habitat connectivity for multiple at-risk species.
Multiple At-Risk Species Ft. Bragg
CurrentApproaches to Land Acquisition Decisions based on expert opinion Connectivity virtually ignored Dispersal considered only for focal species What is Novel? • New Approach • Integrate behavioral and landscape approaches
High Likelihood of Success known occupancy predicted dispersal path observed dispersal path low high Dispersal Resistance • Spatial framework • Environmental data • Habitat-specific movement data • Dispersal models decision-support environment for quantifying connectivity
Movement Data Collection Spatial Data Acquisition Field Data Collection Spatial Data Development Dispersal Modeling Spatial Modeling Transition Integrated Spatial Database Evaluations & Model Updates Implement Decision Support System for Habitat Management Technical Approach
Spatial Data: Acquisition and Development Spatial Data Layers Elevation Hydroperiod Infrastructure Soils Land Use Zoning Site Data Canopy Structure Acquisition & Integration ●Maps & Infrastructure ●Remote Sensing Data ●Ft. Bragg Datasets Development ● Field Data ●Land-Use ●Canopy Structure ●Hydroperiod ● Habitat Maps Final Validations
Spectral distribution functions for each type Field Data Collection & Environmental Data Development : Land Use Random samples stratified by land-use class spectral band 2 spectral band 1 Pasture, Row Crop Forest Plantation Upland Forest Longleaf Pine Woodland Wetlands
~30 Gauges Statistical inundation model: • crest gauge data • digital terrain data •stream gauge data Thermal remote sensing data to extend evaluation of model vented cap 2” pipe Inundation surfaces measuring stick perforated cup with crushed cork perforated cap Field Data Collection & Environmental Data Development : Hydroperiod Crest gauges in known and potential amphibian habitats gauges ground-water level from stream gauge data surface depressions from terrain data stream channel
Spatial Data Layers Elevation Hydroperiod Infrastructure Soils Land Use Zoning Site Data Canopy Structure Habitat Maps Environmental Data Development: Habitat Mapping Land use Habitat Models + Canopy Structure Validate by visiting predicted habitat Occurrence and dispersal data Hydroperiod
Visually track movement behavior of naturally occurring butterflies Experimentally release butterflies in dominant habitats and at their boundaries Monitor dispersal events and occupancy in natural habitats Collection of Movement Data: St. Francis’ Satyr Habitat A Habitat B x r x x r = release point
L1 L2 A1 Movement Data Habitat A Boundary Habitat B High Resistance High Conductivity L1 A1 L3 L2 A2
Turn angle Mean squared distance Number of moves Dispersal Modeling Computer Simulation Analytical Models Habitat B Habitat A Turn angle Move length Habitat B Move length Habitat A Boundary Behavior Kareiva and Shigesada 1983
Spatial Modeling: Landscape Resistance Translate environmental data to resistance surfaces for habitat k and species s: Habitat B rks = 1/slope Distance Moved Habitat A Number of moves rks = low high Water Bldg
Spatial Modeling: Connectivity Determine least-cost paths and least-cost networks Create landscape network of habitats and connecting paths j Costij = resistance-weighted distance along path i rki = lo hi Water Bldg Sensitivity Analyses: Costs/benefits of altering pathways
Test against observed dispersals and habitat occupancy Assess trade-off between information value and data requirements of methods Observed dispersers 1st 2nd 3rd 4th Connectivity between patch pairs (quartiles) Testing Models known occupancy predicted dispersal path observed dispersal path low high Dispersal Resistance
Implementation Use our data and tools to: Map value of land parcels for habitat connectivity Test connectivity impacts of management alternatives Determine optimal connectivity scenarios for multiple species To what extent does optimizing connectivity for one species benefit others?
Year 1 Year 2 Year 3 Year 4 Year 5 Year 1 Year 2 Year 3 Year 4 Year 5 O-06 O-07 A-06 A-07 A-08 D-08 A-09 D-09 A-10 D-10 S-08 S-09 S-10 J-06 J-06 J-07 J-07 J-08 J-08 J-09 J-10 & Dbase Dvlpmt Spatial Data Acquisition Collection of Movement Data Environmental Field Data Collection Spatial Data Development Dispersal Modeling Spatial Modeling Assessments, Comparisons, Updates Produce Final Deliverables Start Duration Progress contingent upon quality assessment of field data and derived products. Overall Project Plan
A decision support system to identify habitat with high conservation value for multiple species Specific recommendations for conservation in the vicinity of Ft. Bragg A set of modeling tools that can be applied to other installations Training 4 PhD students and 3 Post-docs Peer reviewed publications Deliverables
What is known? What is not? Red cockaded woodpecker: Detailed Demographic Model Dispersal – Straight-line, random direction Saint Francis’ satyr: Detailed movement data in breeding habitat only Eastern tiger salamander: Carolina gopher frog: Disperse between breeding and non- breeding habitats Habitat-specific and boundary behavior unknown for all species. Dispersing Bird’s Search Area Flowchart of Male Behavior Search Pattern of a Dispersing Bird
Collection of Movement Data Red cockaded woodpecker • Thirty-five juvenile females fitted with tail-mounted radio-telemetry during dispersal periods of years 1 and 2 • Daily recording of geographic coordinates, hourly when moving. • 2000+ existing dispersal records within study area
Radio telemetry to track movement behaviors of naturally occurring amphibians Monitor dispersal events in occupied ponds using capture-recapture Radio telemetry to track movement behaviors of experimentally released amphibians in dominant habitats and at boundaries Collection of Movement Data ETS & CGF
Field Data Collection: Canopy Structure 25 m Randomly located samples stratified by woody vegetation class Ten plots for each of 8 woody vegetation classes; ten 7 m subplots per plot ● canopy height classes ●percent cover by class ●stem density by class 25 m Train/validate visual and kernal-based methods to extract variables from first-pulse LiDAR DEM
Reviewer Comments Comment: Your study area is extremely large and does not relate to the biology of species proposed for study, except for Red Cockaded Woodpecker. Consideration should be given to reducing the size of study area (for at least some of the species) which should reduce costs. Response: We have reduced the study area by about half. This still encompasses areas of known habitat for all of our study species. Since RCW is a long distance disperser, we have allowed the study area to extend somewhat further to the west and the NE, which are areas of particular interest for RCW management. Comment: Look at the movement of species both on and off of the installation. Response: It is in our research plan to study dispersal both on and off base for all species. Comment: Explain any ecological relationship between the four species or the underlying reasons for selecting these four species. Response: We have a set of speccies with varying habitat requirements, life-histories, and dispersal modes, thus reflecting the varied conservation needs of rare, threatened and endangered species found on many military installations. This reflects the management challenges faced on numerou8s miltary installations and provides a rigorous test case for the methods we propose. Our study species are not strongly related ecologically, except that the amphibians are functionally similar and share habitat. Comment: This project assumes that Dr. Jeffery Walters’ proposal will be funded, what is the implication for this project if Dr. Walters’ is not funded? Response: Funds to modify the RCW model based on movement data were moved from the other project budget to ours in revision, so that our project is no longer dependent on the other one. The two are complimentary however; their relationship is explained in detail in a document submitted to SERDP by Dr. Walters.