Estimation of Diffused pollution loads declination by purchasing Land of Riparian buffer zone
Estimation of Diffused pollution loads declination by purchasing Land of Riparian buffer zone assigned to Dae-cheong water resource area using Remote sensing. Author : Sung-Ryong Ha, Seung-Chul Lee, Chang-Hwan Ko. Presenter : Seung-Chul Lee.

Estimation of Diffused pollution loads declination by purchasing Land of Riparian buffer zone
E N D
Presentation Transcript
Estimation of Diffused pollution loads declination by purchasing Land of Riparian buffer zone assigned to Dae-cheong water resource area using Remote sensing Author : Sung-Ryong Ha, Seung-Chul Lee, Chang-Hwan Ko Presenter : Seung-Chul Lee
Contents • Introduction • Related work • Methods • Results & Discussion • Conclusion
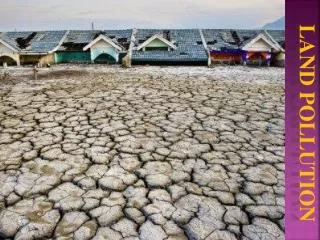
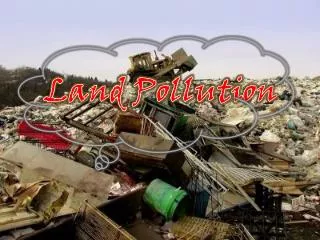
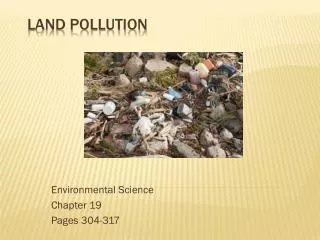
Background • Nonpoint source has been affected to water quality by increasing impervious area because of Urbanization and industrialization. In 2003, Land pollution load formed almost 30 to 35% of total discharged load towater body (Water environment management general planning, 2003). And It is anticipated that This percentage will be increasing continually. • Korean government established the Riparian Buffer Zone (RBZ) to prevent the migration of diffused pollution and to reduce the pollution load from watershed to the water resource. • It has to be placed where they reduce the pollution load effectively. However, increasing impervious area and a thoughtless land use in RBZ have been leading to deterioration of ability to reduce pollution load. • Recently, Remote Sensing (RS) has been used to research into the RBZ due to increasing utility of satellite image. RS is well known as a one of the methods to classify land cover and analyze distribution of vegetation.
Related Work_1 • RBZ & pollution reduction • Many researchers have been studying RBZ and vegetation area to verify their ability as a pollution reduction. • Dillafa et al(1998), Magette et al(1989), Peterjohn & Correll(1984), Young et al(1980) analyzed elimination effect of TSS as controlling width and slope of RBZ. • USDA(1997) presented effective case for reducing pollution as arrangement of vegetation. • Richard et al(2000) studied relation between width of RBZ and reduction effect as each water quality item to purify water quality. • USDA(2001) shown that Nutritive salts and agricultural chemicals are reducing about 50% and 60% of specific bacterium, 70% of Sediment is going down through established RBZ. • Burkart et al(2004) studied to decide position of RBZ using Hydrographical and Geographical information.
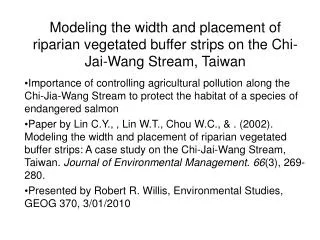
Related Work_2 • RBZ & Remote Sensing • Another group who studies RBZ, has executed a research to apply RS for analysis about distribution of vegetation which is very important factor in RBZ. • Naruimalani et al(1996) used GIS and Landsat-TM imagery to analyze characteristics of Land use patterns in RBZ. • Basnyat et al(2000) studied nitrate reduction effect along the characteristic of Land use patterns in zone where distributed by forest buffers using GIS and satellite imagery. • Congalton et al(2002) studied about vegetation distribution in RBZ to estimate reducing cost effect by using satellite imagery and aerial photograph. • Sawaya et al(2003) used high resolution imagery in his thesis for Land cover classification. Especially, to classify the vegetation properly.
Objective • As a fundamental method, Korean government has been gradually purchasing a land in RBZ for operating a natural ecology restoration project to prevent a thoughtless land use. • It is anticipated that not only Land use but also pollution load will be changed by purchasing a land in RBZ. ⇒ Therefore, This study aimsto analyze land use situationin existing RBZ which was established in Dae-cheong reservoir. And then, estimate effect of pollution load reduction comes from variation of land use at the completed point of time to purchase land in RBZ.
Select A Study Area Land Cover Classification Calculate Area of classified Land Use Computation of Pollution Load Assessmentof Pollution Load Variation by purchasing land Estimation ofPollution Reduction Effect Verify an Accuracy of Classification Methods
Study area • RBZ in Dae-cheong Reservoir watershed • Placed on upper stream of Geum River; One of the 4 main river in Korea. • The area being limited only to the RBZ within 1km along to reservoir offshore has been considered as a study area. For the convenient, we divided into 8 zones as a sub-catchment area.
1 Definition of classification classes 2 Selection of feature 3 Sampling of training data (ROIs) Image Classification with Maximum Likelihood Classification(MLC) 4 5 Verification of result (Error matrix) Land cover classification • decided to use Maximum likelihood classification in supervised classification methods for this study because that is well known as the most accurate method through various thesis. • Process
Result of Land cover Classification 6 land use categories selected Original Landsat TM Image
Verification of classification Accuracy • Accuracy of the Classification was 97.9% overall_accuracy(OA) and 0.96 Khat. • classification was conducted well without classified by chance. <Error matrix>
Zone 6 Zone 1 Zone 7 Zone 2 Zone 4 Zone 8 Zone 3 Zone 5 3D images of Land use in each zone • Index • Blue = water • Yellow = paddy • Pink = building &road • Sky Blue = upland • Green = forest • Brown = barren &sand
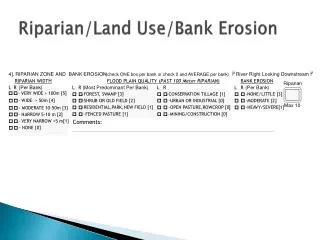
Analysis of Land use in RBZ • A rate of forest area is the highest than any land use categories in every zone. Forest is 63.6% of total area. • Agricultural area is distributed at the rate of 33.3% in RBZ. And rate of impervious area is 1.6%. (Unit : km2)
Korean Government is Purchasing Land in RBZ (Unit : thousand m2) Ministry of Environment republic of Korea, (2005) Planning for developing Ecological park & Vegetation strips in RBZ area
Computation of Pollution Load in RBZ • Formula for Computing land pollution load • L = ∑ ( Ai × Ui ) • Ai : Area(km2) of i land category in a watershed • Ui : Unit(kg/km2/day) of I land category (Unit : kg/km2/day) (National Institute of Environmental Research, 2004)
Reduction rate of pollution load by changing land use in total Zones (BOD) • Effect of pollution load reduction is 90% in 0~50m and 86% in 50~100m by purchasing land in RBZ. • The variation of land use caused by purchasing land affects BOD pollution load reduction. The more distance is close to the water, the more BOD pollution load is increasing in reduction rate.
Zone 3 • Zone 4 • Zone 5 • Zone 6 • Zone 7 • Zone 1 • Zone 2 Reduction rate of pollution load in each Zone (BOD) • Even though, Zone1 to zone7 have a little bit difference caused by area of each zone, Most of pollution load is reduced in an area of 0~100m. • 7 Zones are showing that almost same patterns they have.
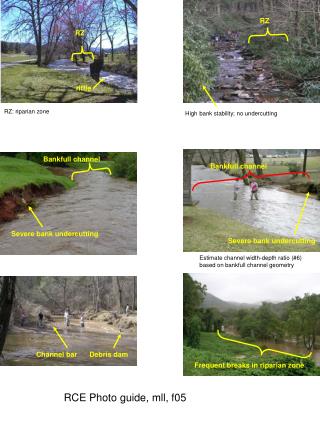
Reduction rate of pollution load in each Zone (BOD) • Zone 8 • Exceptionally, Zone 8 has different pattern of reduction rate. Even there are 65% reduction rate in 500~1000m. • Zone 8 is placed on junction area between tributary and main stream of Dae-cheong reservoir. Even though RBZ is not established in tributary as a small stream, we have to manage that area to reduce pollution load.
Reduction rate of pollution load by changing land use in total Zones (TN, TP) • 53% of TN pollution load is reducing in 0~50m and 54% is reducing in 50~100m as a result of purchasing land. TP is reduced 66% in 0~50m and 65% in 50~100m. • As showing TN and TP reduction rate of pollution load, they are analyzed that TN and TP pollution are reducing similarly in the whole watershed without special pattern as a BOD.
Conclusion(1) • In this study, we analyzed Land use situation in RBZ Which was established in Dae-choeng reservoir using Remote sensing. From that result, we estimated reduction effect of pollution load through variation of Land use at the completed point of time to purchase land. • Reduction rate was the highest from 0m to 50m in all zones. We could know that zone, which was shown as a high reduction rate of pollution load after purchasing land in RBZ, was already developed many parts of land. • Effect of BOD pollution load reduction was 90% in 0~50m and 86% in 50~100m by purchasing land in RBZ. • 53% of TN pollution load was reducing in 0~50m and 54% is reducing in 50~100m as a result of purchasing land. TP was reduced 66% in 0~50m and 65% in 50~100m.
Conclusion(2) • In case of BOD, reduction rate was shown as similar aspect from zone1 to zone7, However zone8 showed high reduction rate from 500m to 1000m especially. It’s because that watershed of zone8 has a tributary. So, this tributary which has already developed land also needs to establish a RBZ. • The pollution load of TN and TP similarly reduced as variation of land use and distance. Those were not largely influenced by variation of land use as a BOD. • In terms of those results, afterward, Korean Government has to preferentially purchase 0~50m area in RBZ near water resource. Also we have to manage simultaneously land use and create vegetation area for reducing pollution of watershed which has tributary.