Download
1 / 20
260 likes | 1.15k Vues
The Index of Biotic Integrity (the BI or IBI). Its Use and Calculation. What does it measure?.

E N D
The Index of Biotic Integrity (the BI or IBI) Its Use and Calculation
What does it measure? • Disturbance of the ecosystem by human actions (i.e., anthropogenic disturbance) can disrupt processes that maintain the integrity of the ecosystem. Most forms of anthropogenic disturbance create structural and functional changes in the ecosystem, which have more permanent consequences on the biota of an ecosystem than the ephemeral effects of naturally occurring floods, storms, or fires.
What does it measure, cont. • Indeed, human activities in the ecosystem like the addition of roads, buildings, and impervious surfaces act as biotic stressors, which are detrimental or disorganizing influences to which a community of organisms is not pre-adapted (Odum 1985).
A measure of ecosystem integrity that integrates impacts over time • Indices have been developed in an attempt to quantify biotic responses to anthropogenic disturbance, which incorporate information on species life histories and functional roles in an ecosystem (Karr and Chu 1999, Fleishman et al. 2006). Calculation of these indices requires knowledge of species life history traits and involves more computational steps than simply counting the number of species. However, these indices are likely more successful at assessing ecosystem condition than just counting species (Fleishman et al. 2006). One such index is the index of biotic integrity (IBI).
Ecosystem Structure • The composition of the biological community including species, numbers, biomass, life history and distribution in space of populations. • The quantity and distribution of the abiotic (non-living) materials such as nutrients, water, etc. • The range, or gradient, of conditions of existence such as temperature, light, etc.
BIOMONITORING Key This page was constructed by Allyson Via-Norton, Amy Maher, and Diane Hoffman All images are copyrighted - Jones & Bartlett Publishers http://kywater.org/ww/bugs/intro.htm http://www.dec.state.ny.us/website/dow/stream/ Comments?
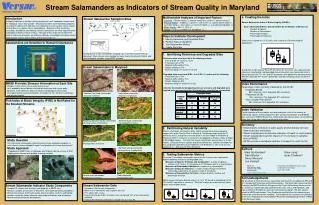
EPT Richness Estimate: • An estimate of the number of different kinds of mayfly (Ephemeroptera), stonefly (Plecoptera), and caddisfly (Trichoptera) • The EPT’s tend to be particularly sensitive to pollution. Therefore, less impacted streams generally have a higher EPT Richness. The EPT Richness can be a useful indicator of stream health and a way to compare two or more different sites. • In Tier 2, the EPT Richness you measure is an estimate because you do not identify the taxa to the family level; instead you simply distinguish between different taxa within each of the three major groups. • http://www.hudsonbasin.org/Tier2web.pdf
Major Group Biotic Index: • This metric takes into account pollution tolerance values that are specifically assigned to each major group of organisms, along with the number, or density of organisms found in each major group. • Different types of macroinvertebrates have a different tolerance to pollution. By counting the number of different types you collect and multiplying by the pollution tolerance of each, it is possible to arrive at a biotic index. • In general, the more pollution intolerant organisms you find, the higher the biotic index, and the less impacted your stream. • http://www.hudsonbasin.org/Tier2web.pdf
Major Group Percent Composition: • Percent Composition is not a single metric that refers to a certain level of impact. It is calculated for each major group by dividing the number or density of organisms in each major group by the total number of organisms in the sub-sample and then multiplying by 100 to convert to percentage. • The relative Percent Composition of organisms in major groups will change with different sites, habitats, and different water qualities. • Calculating Percent Composition gives you a good picture of the community at a particular site. You can use this to compare two different sites or to see how the community at a site changes over time. • A higher Percent Composition of pollution tolerant organisms suggests more impact than a higher Percent Composition of pollution sensitive organisms. • http://www.hudsonbasin.org/Tier2web.pdf
A graph of the abundance of a species as a function of position along a gradient is called a species response curve Under water to increasingly above shoreline http://ordination.okstate.edu/COENOSPA.htm
If long enough gradients are studied, species typically have unimodal (one peak) responses to gradients http://ordination.okstate.edu/COENOSPA.htm
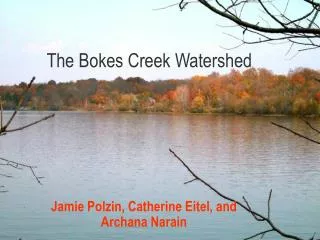
Reporting your Results • Introduction – Why should we be concerned about water quality in Onondaga Creek? What role does the Creek play now and in the past in the lives of the people who live along it? What methods can we use to monitor water quality? What is the advantage of each? Why should we assess water quality in both the upper (rural) and lower (urban) environment of a stream like Onondaga Creek? What are some of the factors that have influenced water quality in Onondaga Creek over time? • Objective -- What is the objective of this field experiment? • Hypothesis – What did you expect to find along the rural to urban gradient through which Onondaga Creek passes? • Methods – What did we do to assess water quality?
Reporting your Results • Results -- Did your findings support your hypothesis? How? Give the results of the metrics you calculated (the Biotic Index, Species Richness, Species Diversity or Eveness, % EPT). How did these things compare to other variables measured along the rural/urban gradient? Show your plots? • Discussion – If your results did not meet your expectations here is where you can discuss why. For instance, were there problems in data collection? Was the sample large enough? How did your results compare to those of McKenna et al. (1999) in your reader? • Conclusion – Overall what have you learned from this exercise about water quality in Onondaga Creek? Based on your measurements and observations of watershed characteristics, what would you say is the most important factor influencing water quality in the Creek? Second most important, etc.? What, if anything, do you think could be done to improve the water quality? What would that do for the residents of the watershed, in particular those who live in the city, and the people of the Onondaga Nation?