Download
1 / 32
320 likes | 508 Vues
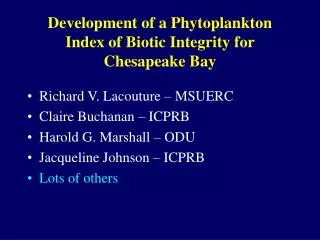
Development of a Phytoplankton Index of Biotic Integrity for Chesapeake Bay. Richard V. Lacouture – MSUERC Claire Buchanan – ICPRB Harold G. Marshall – ODU Jacqueline Johnson – ICPRB Lots of others. “Biological Integrity”. Biological Integrity

E N D
Development of a Phytoplankton Index of Biotic Integrity for Chesapeake Bay • Richard V. Lacouture – MSUERC • Claire Buchanan – ICPRB • Harold G. Marshall – ODU • Jacqueline Johnson – ICPRB • Lots of others
“Biological Integrity” • Biological Integrity - “the capability of supporting and maintaining a balanced, integrated, adaptive community of organisms having a species composition, diversity, and functional organization comparable to that of the natural (minimally impaired) habitat...” (Karr and Dudley 1981) • Index of Biotic Integrity - a set of metrics devised for a specific assemblage of organisms which describes habitat condition for that assemblage - serves as an integrative approach to resource or ecosystem management
Steps in the Development of the PIBI • Data compilation and standardization • Classification of reference and degraded habitat conditions • Metric selection – power to discriminate • Establish scoring criteria for individual metrics - thresholds • Aggregate and score multimetric index • Validate the index using independent data
Habitat ClassificationTHE WATER QUALITY BINNING TECHNIQUE Water Quality Conditions DIN PO4 SECCHI DEPTH Potential Reference Community Most Degraded Least Degraded Water Quality Conditions
Must Pass All Criteria to Be Reference Must Fail All Criteria to Be Impaired Reference Condition CriteriaPhytoplankton SpringSummer Secchi Depth (meters) TF>0.9> 0.8 OH>0.7> 0.6 MH> 1.8> 1.45 PH> 2.15> 1.85 PO4 (mg liter-1) TF< 0.038< 0.027 OH< 0.028< 0.074 MH< 0.011< 0.007 PH< 0.007< 0.007 DIN (mg liter-1) TF< 2.11< 1.91 OH< 1.77< 1.22 MH< 0.96< 0.07 PH< 0.07< 0.07
Metric Selection The Ideal Metric
Meets Expectations Establishing Metric Scoring Thresholds
Discrimination Efficiencies of Individual PIBI Metrics Summer - Percentage of Correct Classifications
PROCESS INDICATORChlorophyll : Carbon Cell chlorophyll content adjusts to ambient light levels. In turbid waters, cells have high chlorophyll -biomass ratios which are indicative of sediment pollution
SPECIES INDICATOR Prorocentrum minimum • High concentrations of Prorocentrum minimum cause mortality and minimal growth rates in juvenile oysters. The frequency of these high concentrations (>3,000 cells/ml) increases as chlorophyll levels increase.
Validation - Classification EfficienciesThis was run on 2003 Monitoring data and 1998-2002 Pfiesteria Monitoring data
Application of the P-IBI • Spatial look at Chesapeake Bay Water Quality Monitoring Program’s phytoplankton sampling stations, 2004 • Temporal look at mainstem Chesapeake Bay stations – spring and summer • Establishing a Restoration Goal based on the P-IBI
Establishing a P-IBI Goal Relative to Chlorophyll a Criteria P-IBI > 4.0 - typically associated with chlorophyll a levels lower than those in P-IBI > 3.0 (*, p<0.05; **, p<0.01) - median levels overlap model-simulated mean chlorophyll a levels that support attainment of all Chesapeake dissolved oxygen criteria
Establishing a P-IBI Goal Relative to Water Clarity Criteria PIBI > 4.0 -typically associated with Secchi depths greater than those in PIBI > 3.0 (*, p<0.05; **, p<0.01) - more closely overlaps Secchi depths habitat requirements of SAV and attainment of Chesapeake Bay water clarity criteria
Establishing a P-IBI Goal Relative to Dissolved Oxygen Criteria PIBI > 4.0 and PIBI > 3.0 - no significant differences in above-pycnocline (AP) waters & spawning/nursery areas; both meeting DO criteria in these areas - low tails of DO distributions in PIBI > 4.0 are slightly higher (better) than those for PIBI > 3.0.
Future Directions for the Phytoplankton Monitoring Programs • Continue to refine and lobby for using P-IBI as a viable indicator of habitat quality by state and Federal managers of Chesapeake Bay • Ultimately, use the P-IBI results in an Ecosystem Index of Biotic Integrity • Document taxonomic changes in the phytoplankton populations of Chesapeake Bay relative to changing water quality conditions, introduced taxa, etc. and the impact that these shifts may have on higher trophic levels • Continue to serve as a sentinel for HAB species and to maintain a historical record of bloom events in Chesapeake Bay