Download
1 / 15
150 likes | 328 Vues
Development of a spatially-explicit index of Chesapeake Bay health. Michael Williams and Bill Dennison (UMCES) Ben Longstaff (EcoCheck) Roberto Llans ó (Versar) Claire Buchanan (ICPRB).

E N D
Development of a spatially-explicit index of Chesapeake Bay health Michael Williams and Bill Dennison (UMCES) Ben Longstaff (EcoCheck) Roberto Llansó (Versar) Claire Buchanan (ICPRB)
The Bay Health Index (BHI) is a spatially-explicit index that represents the major Bay habitats by using data from: 1) mid-channel surface (Secchi, chl-a, PIBI) and water column (DO), 2) benthic community (BIBI) and 3) peripheral shallow-water areas (SAV) Secchi, chl-a, PIBI SAV BIBI DO
Compare to threshold levels Frequency that sample values are below threshold levels (0-100%) Chlorophyll a conc. < thresholds Chlorophyll a conc.
Water quality and biotic parameters combined into indices Water quality WQI BHI Biotic BI Data integrated Compared to thresholds Combined into indices
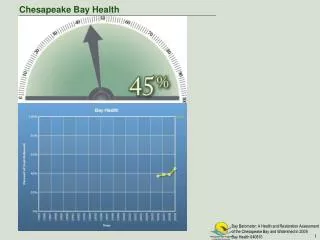
Index values used to calculate report card grades • 15 regions of the Bay • Index: 0 to 100 • Grade: A to F • Release in April • www.eco-check.org 2006
BHI validation • Many water quality parameters respond to interannual changes in flow and associated nutrient and sediment loading from urban and agricultural development in the watershed • Therefore, indices used in the BHI should have distinct differences between low- (2002) & high- (2003) flow years and strong relationships with land use
4 regions w/o PIBI data throughout series & no SAV data for Elizabeth R. (NGZ) • Most of these represent very small area of Bay • Range of BHI values is reasonable considering sustained high loading over this period and legacy effects • As loading is progressively reduced and the Bay’s biogeochemical efficiency recovers, BHI values will increase
Concluding Remarks • We have developed an easy-to-understand, spatially-explicit index that is robust and representative of the health conditions and status of major Chesapeake Bay habitats • Work in progress and other health indices are being developed. Attempts to improve the BHI may involve: • Including higher trophic levels or other indicators (PCBs) • Altering thresholds • Augmenting monitoring efforts for some metrics (e.g., PIBI) • With a doubling of the watershed population predicted to occur over the next decade, new methods of engaging the public and politicians are needed to hasten the implementation of BMPs and reduce nutrient loading • The Bay Health Index and CB Report Card contribute to part of this effort by providing an annual, regional assessment of Chesapeake Bay health
Thanks to many of the Tidal Monitoring and Analysis Workgroup, and Living Resources Analysis Workgroup members of the Chesapeake Bay Program