Foci
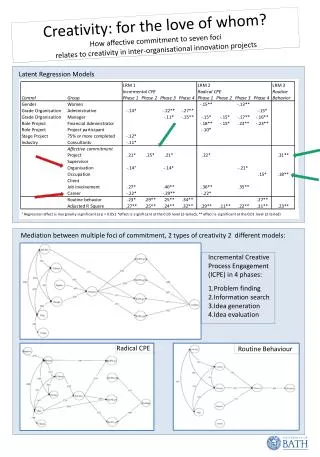
Foci. Figure 1 : Average foci count for each experimental point with the corresponding error bars.

Foci
E N D
Presentation Transcript
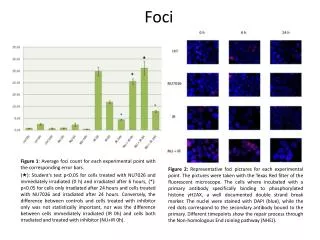
Foci Figure 1: Average foci count for each experimental point with the corresponding error bars. («): Student's test p<0.05 for cells treated with NU7026 and immediately irradiated (0 h) and irradiated after 6 hours, (*): p<0.05 for cells only irradiated after 24 hours and cells treated with NU7026 and irradiated after 24 hours. Conversely, the difference between controls and cells treated with inhibitor only was not statistically important, nor was the difference between cells immediately irradiated (IR 0h) and cells both irradiated and treated with inhibitor (NU+IR 0h). Figure 2: Representative foci pictures for each experimental point. The pictures were taken with the Texas Red filter of the fluorescent microscope. The cells where incubated with a primary antibody specifically binding to phosphorylated histone γH2AX, a well documented double strand break marker. The nuclei were stained with DAPI (blue), while the red dots correspond to the secondary antibody bound to the primary. Different timepoints show the repair process through the Non-homologous End Joining pathway (NHEJ).
Chromosomal breaks Figure 3: Graph of the average breaks per chromosome of MCF7 cancer cells for each experimental point, counted directly from the microscope. All differences were statistically important (p<0.05). Figure 4: Representative pictures of MCF7 chromosomes under a light microscope. On the left there is a picture of chromosomes from control cells. On the right there are chromosomes from cells both irradiated and treated with the inhibitor. The red asterisk (*) signifies the presence of a break on the chromosome, as a result of extensive damage cumulatively inflicted by radiation and repair deficiency caused by NU7026 (specific inhibitor of DNA-PKcs).