Download
1 / 45
450 likes | 584 Vues
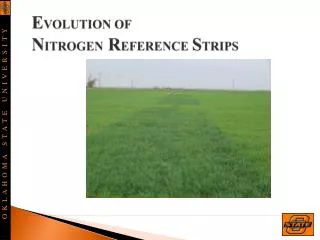
E VOLUTION OF N ITROGEN R EFERENCE S TRIPS. H ISTORY. 1563 Huganote Bernard Palissy advocates the use of fertilizers in agriculture to stimulate plant growth Did so after noticing that crops tended to have better production where manure had been applied. H ISTORY. 1772

E N D
HISTORY • 1563 • Huganote Bernard Palissy advocates the use of fertilizers in agriculture to stimulate plant growth • Did so after noticing that crops tended to have better production where manure had been applied
HISTORY • 1772 • Daniel Rutherford discovers nitrogen • 1790 • French chemist Jean-Antoine-Claude Chaptal coins the name ‘nitrogen’ using a combination of Greek and French words meaning “to engender, bring forth”
HISTORY • 1827 • Justus Liebig’s famous Mineral Theory. • The Mineral Theory states that plant growth is limited by the most limited available mineral in the soil. The application of this theory led to the development of mineral fertilizer.
HISTORY • 1913 • The process that would become known as the Haber-Bosch process was developed by Fritz Haber and Carl Bosch. • The process was the first industrial chemical process to use high pressure for a chemical reaction. • This process is the most economical for the fixation of nitrogen and continues to this day • This process would help usher in the Green Revolution
FERTILIZER APPLICATIONS • Since the introduction of synthetic fertilizers, inaccurate fertilizer rates (either too much or too little) have been applied. • This is the result of failing to recognize temporal variability.
Consistent Yield and Response Ave Yld 42 bu/ac
N Need (Theoretical) N need determined by N-up 112 – N-up check * 50% efficiency
NUE Nitrogen Use Efficiency (NUE) in the world for cereal grain production ~ 33% Crop production directly related to availability of N Need methodologies that consider: Crop production practices Every Farmer is different Aesthetic qualities The crop has to look good Economical analysis The bottom line is what counts Environmental stewardship Pollution costs everyone
EXAMPLE • Fueling a Tractor • John Deere 7810 • 90 gal. Fuel Tank • ~ $315 30gal 60gal 90gal
EXAMPLE • Only Needed 45 gal • Over-filled 45 gal (lost) • Cost ~ $315 • Money lost ~ $157.5 • Fueling a Tractor • John Deere 7810 • 90 gal. Fuel Tank • ~ $315 30 gal 60 gal 90 gal
EXAMPLE • Needed 0 gal • Over-filled 90 gal (lost) • Cost ~ $315 • Money lost ~ $315 • Fueling a Tractor • John Deere 7810 • 90 gal. Fuel Tank • ~ $315 30gal 60gal 90gal • The Fuel Gauge is our reference to how much fuel is in the tank. We can add accordingly.
GAUGE FOR NITROGEN IN OUR FIELDS? • Can there be such a thing? • If so, how? • THE ANSWER…….. • Nitrogen Reference Strips • N-Stamp, N-Rich Strip, N-Ramp
NITROGEN REFERENCE STRIP • An indicator that orients the producer to the nitrogen levels within the field to aid in making a better mid-season nitrogen rate recommendation. • Superimposed on existing farmer pre-plant practices • Provides a measure of how much additional N is needed, if any • Minimizes risk
NITROGEN RICH STRIP – 2002 – Present • Current practices for making mid-season fertilizer N recommendations in most crops are not consistent from one region to the next • 1 N rate – In excess of what is required by the plant for the entire growing season. • Answers the question – Do I need to apply any additional N fertilizer? • YES or NO • With GreenSeeker sensor and SBNRC can obtain RI, predict yield potential, and determine optimum N rate for maximum yield
Ramp Calibration Strip Fertilization Strategy – 2006 – 2009 Concept of visually evaluating plots with incremental rates of pre-plant N Identify minimum N rate required for maximum production
When Empty: 90 gal • Over-filled 0 gal ( 0 gal lost) • Cost ~ $315 • Money lost ~ $0 • ONLY PUT IN WHAT IS NEEDED! EXAMPLE • Fueling a Tractor • John Deere 7810 • 90 gal. Fuel Tank • ~ $315 30gal 60gal 90gal
EXAMPLE • When Half-Full: 45 gal • Over-filled 0 gal ( 0 gal lost) • Cost ~ $157.5 • Money lost ~ $0 • ONLY PUT IN WHAT IS NEEDED! • Fueling a Tractor • John Deere 7810 • 90 gal. Fuel Tank • ~ $315 30 gal 45 gal
EXAMPLE • When Full: 0 gal • Over-filled 0 gal (0 gal lost) • Cost ~ $0 • Money lost ~ $0 • ONLY PUT IN WHAT IS NEEDED! • Fueling a Tractor • John Deere 7810 • 90 gal. Fuel Tank • ~ $315 0gal • The Fuel Gauge is our reference to how much fuel is in the tank. We can add accordingly.
LIKEWISE… • N-REFERENCE STRIPS • OUR GAUGE TO THE NITROGEN LEVEL IN THE FIELD • OUR GAUGE TO IDENTIFY HOW MUCH ADDITIONAL NITROGEN, IF ANY, IS NEEDED BY THE CROP TO PRODUCE MAXIMUM YIELDS.
N-Rich Strip Mid-Season Evaluation of N Rich Strip (Ciudad Obregon, MX)Average Wheat Yields = 150 bu/ac (irrigated spring wheat) 300 lbs N ac-1 0 lbs N ac-1
Sensor Based N Rate Calculator SBNRC and the N-Rich Strip Using Sensor Data and the Nitrogen Fertilizer Optimization Algorithm, N-Rates are prescribedfor each field and its condition/environment.
NDVI= NIR – Red NIR + Red Spectral Response to Nitrogen NIR Red
What is needed for a Sensor Based Nitrogen Rate Calculator? • Yield Prediction Model • Response Index • Nitrogen Removal The calculation looks like: N Rate = (Potential Yield of Farmer Practice * RI- YP FP)* N in Grain / NUE
Predicted yieldwith N fertilization(YPN) Matt Steinert, Covington, OK (March 20, 2003) Response Index =0.75/0.57 = 1.31 RI N-Rich Strip Farmer Practice Planting date Predicted yieldwith no added Nfertilization (YP0) days from planting to sensing NDVI (sensing date) INSEY = (NDVI/days from planting to sensing where GDD>0)YPN = YP0 * RIFertilizer N = (Grain N uptake at YPN – Grain N uptake at YP0)/0.7
Yield Prediction SBNRC (YP0*RI =YPN) 100 Pre (100 lbs N/ac applied preplant)
Optical Sensors • Numerical, describe the crops BIOMASS. • DOES NOT really WORK WITH OUT A REFERENCE.......... • Multiple options • Companies • Resolution
EXTENSION AND ANALYSISOF THE RAMP CALIBRATION STRIP FERTILIZATION STRATEGY
PURPOSEOFSTUDY2007 Intentions Implement & Evaluate the RCS strategy in the following crops: Alfalfa Bermudagrass Corn Cotton Grain Sorghum Extend the RCS strategy in the following crop: Wheat
MATERIALS&METHODS Grain Sorghum 4 replications of 5 treatments + 1 or 2 N-Ramp(s) Complete Randomized Block Design Experiment site – R.L. Westerman Irrigation Research Center located west of Stillwater, OK.
Grain SorghumApplication of N-Ramp StrategyR.L. Westerman Irrigation Research Center at Lake Carl Blackwell N W E S Plot size: 3 m x 6 m Alley: 1.5 m 4 replications Ramp: 4.25 m x 52 m
GRAIN SORGHUM– RESULTS Average Yields Gross Return: N cost = $1.01 / kg, Sorghum = $0.125 / kg $0.46 / lb $0.057 / lb
N Rich Strip Adoption • 2003: OSU applied 62 NRS • 2004: 300 NRS in Farmers Fields • 2005: SBNRC released, 1000 NRS • 2006: OSU applied 568 NRS1,500 NRS by 1 cooperator aloneestimated 230,000 acres under NRS • 2007: 25 county educators reported having NRS • 2009: Survey reported 4,000 NRS
WHEAT –EXTENSIONOFN-RCSAPPROACH Recap Fall 2006 N-Ramps placed in 586 farmer fields throughout Oklahoma covering a service area of 81,000 hectares (200,000 Acres)
WHEAT –EXTENSIONOFN-RCSAPPROACH • Fall 2007 • N-Ramps or N-Rich Strips placed in 224 farmer fields throughout Oklahoma
February/March 2007 County Extension Agents Sensed N-Ramps Provided top-dress N recommendations to producers Collected data for submission to N-Ramp extension team
EXTENSIONOF N-RCS APPROACHIN WHEAT– RESULTS Average Typical Top-Dress N Rate 125 kg N / ha (110 lb N/Ac) Average RCS N-Recommendation 60 kg N / ha (53 lb N/Ac) Average Actual Top-Dress N Applied 90 kg N / ha (80 lb N/Ac) 50 % more than the RCS recommendation 73 % of typical top-dress N rate Represents savings of $ 35.45 ha-1 ($13.80 Ac-1) Represents total savings of $ 2,760,000
CONCLUSIONS Current practices for making mid-season fertilizer N recommendations in most crops are not consistent from one region to the next The N-Ramp Approach: Using automated gradients of pre-plant N fertilizer to determine mid-season N rates based on plant response Applied methodology integrating farmer input and insight in the decision making process Provides visual mid-season alternative approach for N fertilization