Download
1 / 1
10 likes | 99 Vues
An Examination of “Bubble” Practices in Arkansas Public Schools. Anna M. Jacob, Clay S. Johnson, James L. Woodworth, Gary Ritter. Introduction

E N D
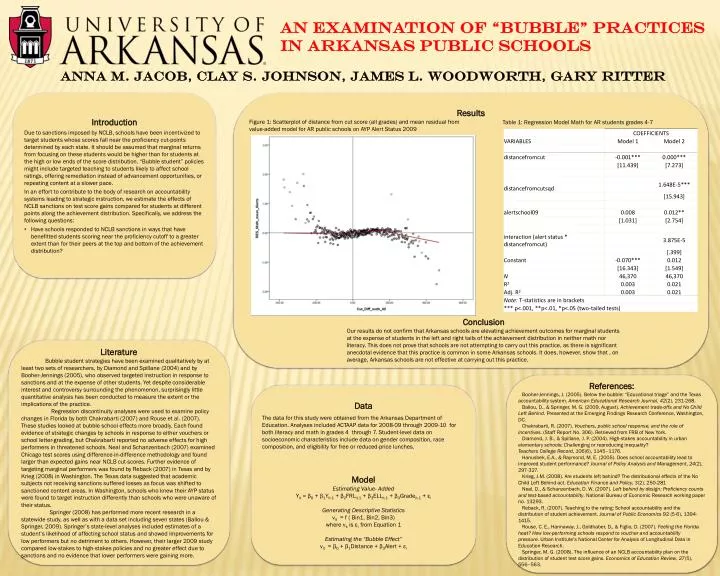
An Examination of “Bubble” Practices in Arkansas Public Schools Anna M. Jacob, Clay S. Johnson, James L. Woodworth, Gary Ritter • Introduction • Due to sanctions imposed by NCLB, schools have been incentivized to target students whose scores fall near the proficiency cut-points determined by each state. It should be assumed that marginal returns from focusing on these students would be higher than for students at the high or low ends of the score distribution. “Bubble student” policies might include targeted teaching to students likely to affect school ratings, offering remediation instead of advancement opportunities, or repeating content at a slower pace. • In an effort to contribute to the body of research on accountability systems leading to strategic instruction, we estimate the effects of NCLB sanctions on test score gains compared for students at different points along the achievement distribution. Specifically, we address the following questions: • Have schools responded to NCLB sanctions in ways that have benefitted students scoring near the proficiency cutoff to a greater extent than for their peers at the top and bottom of the achievement distribution? Results Figure 1: Scatterplot of distance from cut score (all grades) and mean residual from value-added model for AR public schools on AYP Alert Status 2009 Table 1: Regression Model Math for AR students grades 4-7 Conclusion Our results do not confirm that Arkansas schools are elevating achievement outcomes for marginal students at the expense of students in the left and right tails of the achievement distribution in neither math nor literacy. This does not prove that schools are not attempting to carry out this practice, as there is significant anecdotal evidence that this practice is common in some Arkansas schools. It does, however, show that , on average, Arkansas schools are not effective at carrying out this practice. Literature Bubble student strategies have been examined qualitatively by at least two sets of researchers, by Diamond and Spillane (2004) and by Booher-Jennings (2005), who observed targeted instruction in response to sanctions and at the expense of other students. Yet despite considerable interest and controversy surrounding the phenomenon, surprisingly little quantitative analysis has been conducted to measure the extent or the implications of the practice. Regression discontinuity analyses were used to examine policy changes in Florida by both Chakrabarti (2007) and Rouse et al. (2007). These studies looked at bubble school effects more broadly. Each found evidence of strategic changes by schools in response to either vouchers or school letter-grading, but Chakrabarti reported no adverse effects for high performers in threatened schools. Neal and Schanzenbach (2007) examined Chicago test scores using difference-in-difference methodology and found larger than expected gains near NCLB cut-scores. Further evidence of targeting marginal performers was found by Reback (2007) in Texas and by Krieg (2008) in Washington. The Texas data suggested that academic subjects not receiving sanctions suffered losses as focus was shifted to sanctioned content areas. In Washington, schools who knew their AYP status were found to target instruction differently than schools who were unaware of their status. Springer (2008) has performed more recent research in a statewide study, as well as with a data set including seven states (Ballou & Springer, 2009). Springer’s state-level analyses included estimates of a student’s likelihood of affecting school status and showed improvements for low performers but no detriment to others. However, their larger 2009 study compared low-stakes to high-stakes policies and no greater effect due to sanctions and no evidence that lower performers were gaining more. References: Booher-Jennings, J. (2005). Below the bubble: “Educational triage” and the Texas accountability system. American Educational Research Journal, 42(2), 231-268. Ballou, D., & Springer, M. G. (2009, August). Achievement trade-offs and No Child Left Behind. Presented at the Emerging Findings Research Conference, Washington, DC. Chakrabarti, R. (2007). Vouchers, public school response, and the role of incentives. (Staff Report No. 306). Retrieved from FRB of New York. Diamond, J. B., & Spillane, J. P. (2004). High-stakes accountability in urban elementary schools: Challenging or reproducing inequality? Teachers College Record, 106(6), 1145–1176. Hanushek, E.A., & Raymond, M. E. (2005). Does school accountability lead to improved student performance? Journal of Policy Analysis and Management, 24(2), 297-327. Krieg, J.M. (2008). Are students left behind? The distributional effects of the No Child Left Behind act.Education Finance and Policy,3(2), 250-281 Neal, D., & Schanzenbach, D. W. (2007). Left behind by design: Proficiency counts and test-based accountability. National Bureau of Economic Research working paper no. 13293. Reback, R. (2007). Teaching to the rating: School accountability and the distribution of student achievement. Journal of Public Economics 92 (5-6), 1394-1415. Rouse, C. E., Hannaway, J., Goldhaber, D., & Figlio, D. (2007). Feeling the Florida heat? How low-performing schools respond to voucher and accountability pressure. Urban Institute’s National Center for Analysis of Longitudinal Data in Education Research. Springer, M. G. (2008). The influence of an NCLB accountability plan on the distribution of student test score gains. Economics of Education Review, 27(5), 556–563. Data The data for this study were obtained from the Arkansas Department of Education. Analyses included ACTAAP data for 2008-09 through 2009-10 for both literacy and math in grades 4 through 7. Student-level data on socioeconomic characteristics include data on gender composition, race composition, and eligibility for free or reduced-price lunches. Model Estimating Value- AddedYit = β0 + β1Yit-1 + β2FRLit-1 + β3ELLit-1 + β4Gradeit-1 + εiGenerating Descriptive Statisticsνit = f ( Bin1, Bin2, Bin3) where νitis εifrom Equation 1Estimating the “Bubble Effect” νit = β0 + β1Distance + β3Alert + εi