Download

1 / 21
260 likes | 507 Vues
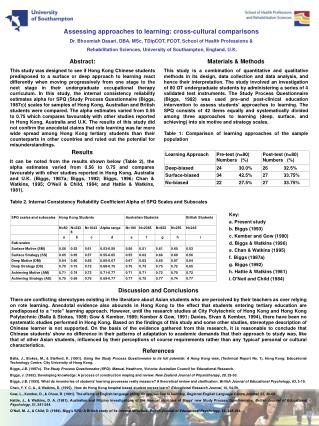
Assessing measurement invariance in cross-cultural research. Hans Baumgartner Penn State University. Jan-Benedict E.M. Steenkamp and Hans Baumgartner, “Assessing Measurement Invariance in Cross-National Consumer Research,” Journal of Consumer Research , 25 (June), 78-90. Key points.

E N D
Assessing measurement invariance in cross-cultural research Hans Baumgartner Penn State University
Jan-Benedict E.M. Steenkamp and Hans Baumgartner, “Assessing Measurement Invariance in Cross-National Consumer Research,” Journal of Consumer Research, 25 (June), 78-90.
Key points • Types of invariance: • configural • metric • scalar • Degree of invariance • full • partial • The type of invariance required depends on the goal of the research: • comparison of relationships between constructs • comparison of factor means
Configural invariance 1 1 x1 x1 x2 x2 Group 1: x6 x6 x1 x1 x2 x2 x3 x3 x5 x5 x7 x7 x4 x4 x8 x8 Group 2:
Metric invariance 1 x1 x2 Group 1: x6 x1 x2 x3 x5 x7 x4 x8 1 x1 x2 Group 2: x6 x1 x2 x3 x5 x7 x4 x8
Scalar invariance 1 x1 x2 Group 1: x6 x1 x2 x3 x5 x7 x4 x8 1 x1 x2 Group 2: x6 x1 x2 x3 x5 x7 x4 x8
Key points • Types of invariance: • configural • metric • scalar • Degree of invariance • full • partial • The type of invariance required depends on the goal of the research: • comparison of relationships between constructs • comparison of factor means
Partial measurement invariance • for identification purposes, one item per factor has to have invariant loadings and intercepts (marker item); the marker item has to be chosen carefully; • at least one other invariance constraint on the loadings/ intercepts is necessary to ascertain whether the marker item satisfies metric/scalar invariance;
Metric invariance 1 x1 x2 1 Group 1: 1 x6 x1 x2 x3 x5 x7 x4 x8 1 x1 x2 1 Group 2: 1 x6 x1 x2 x3 x5 x7 x4 x8
Key points • Types of invariance: • configural • metric • scalar • Degree of invariance • full • partial • The type of invariance required depends on the goal of the research: • comparison of relationships between constructs • comparison of factor means
Linking the types of invariance required to the research objective
Comparing relationships between constructs 1 ξ η x y y x x y
Comparing means of constructs 1 ξ η x y y x x y x = x + lx + y = y + lyh + e E(x) = x + lxE() E(y) = y + lyE(h)
He, Merz, and Alden (2008) content analysis of 243 cross-nationally focused, empirical marketing articles published between 2000 and 2005 in 15 peer-reviewed journals; 67 articles (28%) reported assessing MI (in 82% of cases based on CFA); for 41 articles (17% of the total) the type of MI assessed was consistent with the goal of the study; assessment of MI was less likely if more countries were involved in the study and if single-item measures were used;
He, Merz, and Alden (cont’d) • in a follow-up study, 86 authors indicated the following: • self-reported knowledge of MI assessment was relatively low (4.51 on 7-point scale); • MI assessment was not viewed as particularly important (4.12) [although positive correlation with knowledge]; • MI assessment was not reported because • the data were not conducive to it • it was not viewed as necessary • familiarity with the method was insufficient
Life satisfaction in Austria and the US • 393 Austrian and 1181 U.S. respondents completed the Satisfaction with Life Scale (SWLS; Diener et al. 1985), which is a well-known instrument used to assess the cognitive component of subjective well-being. The scale consists of the following five items: • In most ways my life is close to my ideal. • The conditions of my life are excellent. • I am satisfied with my life. • So far I have gotten the important things I want in life. • If I could live my life over, I would change almost nothing. • Respondents indicated their agreement or disagreement with these statements using the following five-point scale: 1 = strongly disagree, 2 = disagree, 3 = neither agree nor disagree, 4 = agree, and 5 = strongly agree. • Perform an analysis of measurement invariance on the SWLS and test whether Austrian or American respondents are more satisfied with their lives (if possible).
Indicator means by country GROUP: AUT Means ls1 ls2 ls3 ls4 ls5 -------- -------- -------- -------- -------- 3.57 3.63 3.91 3.81 3.31 GROUP: USA Means ls1 ls2 ls3 ls4 ls5 -------- -------- -------- -------- -------- 2.97 3.04 3.26 3.33 2.75 Mean D .60 .58 .65 .52 .56 D/ .65 .65 .65 .65 ?
What happens for ls5? • Difference in latent means is: 3.91 - 3.26 = .65 • Adjusting for difference in loadings leads to a difference of : (1.1.0)(3.91) – (.83)(3.26) = 1.62 • Adjusting for difference is intercepts leads to: (4.31 – 1.00) – (2.69 + .06) = .56