Download
1 / 9
300 likes | 846 Vues
Measurement Invariance: Why and How?. Rosie Ensor, Claire Hughes, Martha Hart and Anji Wilson. Measurement Invariance: an important (and easy to test) pre-requisite for many analyses. Why?

E N D
Measurement Invariance: Why and How? Rosie Ensor, Claire Hughes, Martha Hart and Anji Wilson
Measurement Invariance: an important (and easy to test) pre-requisite for many analyses Why? • Equivalence of measurement characteristics of indicators over time are necessary (but not sufficient) to demonstrate ‘true’ change • E.g. Each decade, IQ scores increase (Flynn effect) but scores are not comparable over time • It is also important to evaluate equivalence of measurement characteristics of indicators across groups • E.g. IQ scores sometimes differ according to ethnicity, but scores are not necessarily comparable between groups How? • Confirmatory Factor Analysis (CFA) parameters (unstandardized) can be restricted to be equal in value • Indicators have the same metric if parameters are equivalent • CFAs with equality constraints are nested models and so can be evaluated using χ2 difference tests
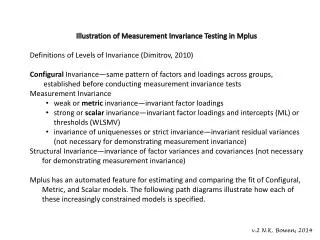
How to test longitudinal measurement invariance • Step 1: model the same factor structure at both time-points • Step 2: constrain like indicator factor loadings to be equal • Use χ2 difference test to evaluate if constraints significantly degrade model fit • If not, a 1 unit increase in the latent construct reflects the same increase in repeated indicators • Step 3: place equality constraints on like indicator intercepts • Use χ2 difference test to evaluate if constraints significantly degrade model fit • If not, at a constant level of latent construct, the repeated indicators have a similar score • Step 4: test the equality of like indicator error variances • χ2 difference test will show a significant decrease in model fit • Not as important to evaluation of measurement invariance as prior steps
EF_4 BY P_4 IC_4 WM_4; EF_6 BY P_6 IC_6 WM_6; [P_4@0]; [P_6@0]; [EF_4*]; [EF_6*]; Structure EF 6 EF 4 EF_4 BY P_4 IC_4(1); EF_4 BY WM_4(2); EF_6 BY P_6 IC_6(1); EF_6 BY WM_6(2); [P_4@0]; [P_6@0]; [EF_4*]; [EF_6*]; [IC_4 IC_6] (3); [WM_4 WM_6] (4); Loadings Intercepts P 6 IC 6 WM 6 P 4 IC 4 WM 4 Example analysis and syntaxTracking Executive Function Across the Transition to SchoolHughes, C., Ensor, R., Wilson, A. and Graham, A. (under review) • At ages 4 and 6, 190 children completed planning, inhibitory control and working memory tests • Good performance on EF tasks requires many non-executive processes • Having adjusted to structured school environment, children may cope more readily with peripheral test demands critical value of χ2 (2) = 5.99, p = .05 • Equal structure: χ2 (8) = 10.95 • Equal loadings: χ2 (10) = 14.97, χ2diff (2) = 4.02, ns • Equal intercepts: χ2 (12) = 17.90, χ2diff (2) = 2.93, ns
How to test measurement invariance across two or more groups • Alternative terms for across-group measurement invariance: • Equal factor structure = configural invariance • Equal factor loadings = metric / weak factorial invariance • Equal indicator intercepts = scalar / strong factorial invariance • Equal indicator residuals = strict factorial invariance • Establishing measurement invariance enables tests of population heterogeneity: Do structural parameters vary across groups? • CFA with covariates: indicators and / or latent factors are regressed onto a dummy variable denoting group membership • Significant direct effect of covariate on indicators = variant intercepts • Significant effect of covariate on latent factor = group difference in factor means • Multiple-groups CFA: simultaneous analysis of CFA in 2 (or more) groups • Two separate input matrices and measurement models • Similar procedures to those for testing longitudinal measurement invariance • Also, can constrain factor variances, factor covariances, latent means in both groups
Gender S M F W S W Ag Di Ar Ag Ag Di Di Ar Ar Ne Ne Ne F M Ag Di Ar Ne Example CFA with covariatesChildren’s Problem Behaviors with Siblings and FriendsHughes, C., Hart, J.M., Wilson, A. and Ensor, R. (under review) • Observations of antisocial behaviours within structured play are sometimes more ecologically valid for boys than girls • 97 6 year olds’ (56 boys) aggression, disruption, arousal and negative affect were rated using 4-point scales from videos of interaction during marbles and walk the plank games with friends and siblings • Significant direct effect of gender on three indicators: z ≥ 2.37 • At any given value of latent construct of problem behaviours while playing marbles game with friends: • boys > girls for aggression (.27 units) and disruption (.75 units) • girls > boys for arousal (.12 units)
VARIABLE: Names are id Ag Di Ne Ar FM FW SM SW; USEVAR ARE Ag Di Ne Ar SM; GROUPING IS SM (0 = rest 1= SM); ANALYSIS: ESTIMATOR=ML; MODEL=NOMEAN; INFORMATION=EXPECTED; MODEL: behave BY Ag Di Ne Ar; MODEL SM: behave BY Di Ne Ar; Intercepts Loadings critical value of χ2 (3) = 7.81, p = .05 Example multiple-groups CFAChildren’s Problem Behaviors with Siblings and Friends Hughes, C., Hart, J.M., Wilson, A. and Ensor, R. (under review) • Observation data may reflect context specificity and day-to-day variability • 4 ‘groups’ → Marbles / Walk the Plank with Siblings / Friends • Measurement characteristics of indicators in each group compared with those of other 3 groups combined • for example: Marbles with Siblings vs. other three groups • If indicator means included in model, MPlus default is to hold factor loadings and intercepts to equality across groups • Equal structure: χ2 (4) = 1.4 • Equal loadings: χ2 (7) = 3.67, χ2diff (3) = 2.27, ns • Equal intercepts: χ2 (10) = 6.72, χ2diff (3) = 3.05, ns
Partial measurement invariance • If the equality constraints on a ‘family’ of parameters (e.g., factor loadings) leads to a significant increase in χ2: • Establish whether a particular constrained parameter has a high impact • Modify the model by freely estimating the potentially variant parameter • Test whether the modified model leads to a significant increase in χ2 • Further tests of invariance can proceed in context of partial measurement invariance • Minimum requirement: other than marker, at least one invariant indicator • Example multiple-groups CFA: Marbles with Friends vs. other 3 groups • Equal structure: χ2 (4) = 2.38 • All like loadings were constrained to equality: χ2 (7) = 13.46, χ2diff (3) = 11.08, p <. 05 • Aggression was marker indicator, negative affect was freely estimated, arousal and disruption were constrained to equality: χ2 (6) = 3.77, χ2diff (2) = 1.39, ns • Equal intercepts: χ2 (9) = 9.03, χ2diff (3) = 5.26, ns critical value of χ2 (2) = 5.99, p = .05 χ2 (3) = 7.81, p = .05
Conclusions • The examination of measurement invariance should precede analyses of longitudinal data • latent growth curve models • autoregressive / cross-lagged models • Comparison of group latent means is analogous to ANOVA but preceding tests of measurement invariance indicate appropriateness of analysis of group differences • Structural parameters can be analysed, even in the context of partial measurement invariance