Graphics and Graphic Information Processing J. Bertin
270 likes | 418 Vues
Graphics and Graphic Information Processing J. Bertin. Presented by Fusun Yaman. Overview. Introduction Description of the paper My favorite sentence Contributions Notes on the references Critique What happened to this topic. Introduction.

Graphics and Graphic Information Processing J. Bertin
E N D
Presentation Transcript
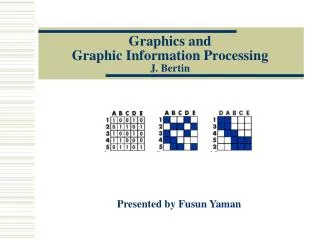
Graphics and Graphic Information Processing J. Bertin Presented by Fusun Yaman
Overview • Introduction • Description of the paper • My favorite sentence • Contributions • Notes on the references • Critique • What happened to this topic
Introduction • Section from Graphics and Graphic Information Processing(1977/1981) • Problem addressed in section B • Collection of objects that are described by n characteristics • How to graphically represent this information when usually n > 3
Terminology • Information is in Data Table • Objects correspond to cases (A, B, C, D) • Characteristics correspond to variables (income,education, experience)
Terminology (continued) • Objects can be • Ordered (0) , like months • Reorderable (), like individuals • Topographic (T), like cities • Characteristics can be • Nominal, like movie titles • Ordinal, like movie ratings • Quantitative, like length of the movie
“Impassable barrier” • Image has only 3 dimensions • This barrier is impassable • Le n be number of variables (rows) • n 3 : Use scatter plots • n > 3: Other solutions needed
Solutions for n > 3 • Constructing several scatter plots • Sacrificing overall relationship • Constructing a matrix • Overall relationship is discovered by permutations
Synoptic • Classifies graphic constructions according to two properties of Data Table • If n is number of characteristics • n > 3 and n 3 • Nature of objects • Ordered , reorderable, topographic
Graphics for n 3 • Matrix construction when objects are reorderable
Graphics for n 3 • Arrays of curves when objects are ordered
Graphics for n 3 • Scatter plots for both reorderable and ordered cases • Third row is represented by the size of the marker (9)
Graphics for n 3 • In topographies bi- or tri-chromatic superimposition reveals the overall relation ships
Graphics for n > 3 • Objects and characteristics are reorderable () • Reorderable matrix • Objects are ordered, characteristics are reorderable • Image file (2) • Array of curves when slops are meaningful (3) • Ordered objects and characteristics • Collection of tables or maps (4,5) • Use super imposition to discover similar groups
Reorderable Matrix • Objects and characteristics are reorderable () • Permutable in x and y • Overall relationship is discovered by permutations • What if characteristics are not nominal?
Special Cases for () • Weighted matrix • Areas become meaningful • Applicable to a data table in which row and column totals are meaningful • Limited in dimension • Matrix-file • When one of the dimensions is too large • Constructed similar to image files • Use sorting to discover correlations
Image File • Used for ordered objects and reorderable characteristics • One card for each characteristic • Values greater than the mean of that row are darkened
Matrix-File • Special case for permutable matrix; one of the dimensions is too big. • Large number of objects across a small number of characteristics. • Constructed similar to image files • Use sorting to discover correlations
Matrix-File Example • Ordered by salary, origin, age • Higher salaries are paid to men, who are married, older and who have more childeren then others
Graphics for Networks • A network portrays the relationships that exists among the elements of a single component. • can also be represented in matrix form • If this component is • Reorderable: network is transformable on a plane (19) • Ordered: network is transformable on one dimension (20) • Topography: non-transformable; ordered network (21)
Utilization of Synoptic • Using synoptic choose the appropriate graphic construction for your data • Deviating from suggested construction leads to loss of information and requires justification • Size limitations
My favorite Sentence • “A problem involving n rows does not correspond to n problems involving one row.” • “[Graphics] is a strict and simple system of signs, which anyone can learn to use and which leads to better understanding.”
Contributions • Synoptic • Classification scheme for 2D graphical presentation • Permutation Matrix • General solution for more than 3 variables • (In the book) Identifies seven visual variables • Position,size, value, orientation, color, texture and shape
References • The book has no reference section! • Semiology of graphics: Diagrams, networks, maps, J. Bertin, 1967 • Identifies basic elements of diagrams • Describes a framework for their design
Critique • Strength of the paper • One image summerizes his all theory on graphic construction selection • Weakness of the paper • No 3D discussion • Not easy to follow, lack of examples (in the given section) • Outdated implementation techniques
What happened to this topic? • Formed a basis for research in Information Visualization • Graphical constructions and ideas presented in this section are implemented in information visualization tools • Tablelens (matrix file) • Spotfire (scatter plots using seven visual variables)
What happened to this topic? • Classification enabled auotomation studies • Automating the design of graphical presentations of relational information, Mackinlay • 1987 NSF report, DeFanti (uses the term visualization) • Extension to 3D graphics • Information Animation Applications in the capital markets, Wright • 1987 NSF report, DeFanti