Information Graphics
Explore the principles of graphical excellence as articulated by Edward Tufte, a pioneer in data visualization and professor emeritus at Yale University. This comprehensive overview emphasizes the importance of clarity, precision, and efficiency in presenting complex data effectively. Tufte argues that outstanding visualizations convey the most information in the least space and promote deeper understanding without distorting the data. From the analysis of historical data graphics to modern applications, discover how effective visuals can enhance decision-making and reveal insights that might otherwise be overlooked.


Information Graphics
E N D
Presentation Transcript
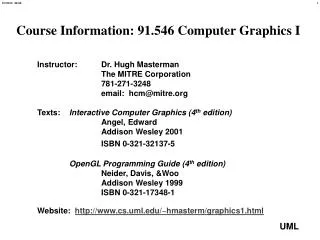
Information Graphics Joyeeta Dutta-Moscato July 9, 2013
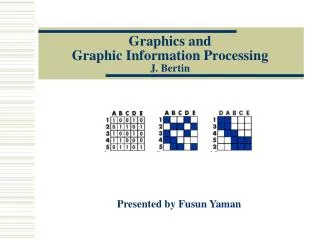
Edward Tufte (1942- ) Yale University Professor Emeritus in Political Science, Computer Science, Statistics & Senior Critic, School of Art Pioneer in the field of data visualization http://www.edwardtufte.com/tufte/
Graphical Excellence • Excellence in statistical graphic consists of complex ideas communicated with clarity, precision, and efficiency. • Graphical displays should: • Show the data • Induce the viewer to think about substance, rather than methodology • Avoid distorting what the data have to say • “Excellent visualizations are those that give the viewer the greatest number of ideas in the shortest amount of time, with the least ink and in the smallest space.” In essence, data illustration is about simplifying the complex as much as possible. • When the data-rich illustrations are examined closely, every data point has a value, but when they are looked at more generally, only trends and patterns can be observed – a macro/micro reading, presented in the space of an eye-span Edward Tufte, ‘The Visual Display of Quantitative Information’
Graphical Excellence • Graphical excellence is the well-designed presentation of interesting data • - a matter of Substance, Statistics and Design • Graphical excellence is almost always multivariate • Graphical excellence is that which gives the viewer the greatest number of ideas in the shortest time with the least ink in the smallest space. • Graphical excellence requires telling the truth about the data. Edward Tufte, ‘The Visual Display of Quantitative Information’
Anscombe’sQuartet Good graphics reveal data Anscombe’s quartet
Non-Informative Graphics The 1986 destruction of the Space Shuttle Challenger, which was due to a damaged O-ring seal, has been attributed in part to a failure of data analysis. Decision-makers at the US space agency, NASA, were uncertain about whether to launch the space shuttle in below-freezing temperatures. • They had the data
Informative Graphics Edward Tufte later pointed out, this disaster could have been avoided had the data been more clearly conveyed through the use of a graphic. A visualization prioritizing information makes obvious the risk of O-ring damage in extreme cold temperatures.
Misleading Graphics http://www.forbes.com/sites/naomirobbins/2012/08/04/another-misleading-graph-of-romneys-tax-plan/
Misleading Graphics http://mediamatters.org/blog/2012/08/09/today-in-dishonest-fox-charts-government-aid-ed/189223
Misleading Graphics http://mediamatters.org/blog/2012/03/16/another-whopper-from-foxs-graphics-department/185186
Misleading Graphics http://www.buzzfeed.com/ebroodle/fox-news-pie-chart-fail-68j
Graphical Excellence • Graphical excellence is the well-designed presentation of interesting data • - a matter of Substance, Statistics and Design • Graphical excellence is almost always multivariate • Graphical excellence is that which gives the viewer the greatest number of ideas in the shortest time with the least ink in the smallest space. • Graphical excellence requires telling the truth about the data. Edward Tufte, ‘The Visual Display of Quantitative Information’
Krzywinski, M. et al. Circos: an Information Aesthetic for Comparative Genomics. Genome Res (2009) 19:1639-1645
CIRCOS The human genome is comprised of 22 pairs of chromosomes 1-22 and the pair of sex chromosomes X,Y. Individual chromosomes range from about 50 Mb (chr 21) to about 250 Mb (chr 1) and together compose the 3 Gb human genome.
Acknowledgments Liz Marai, Dept. of Comp Science Harry Hochheiser, Dept of Biomedical Informatics