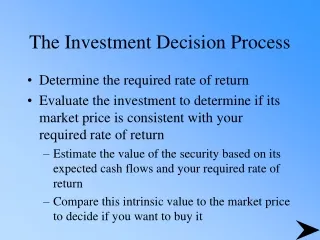
Comprehensive Overview of the Investment Process: Analysis and Strategy Insights
This presentation, delivered on December 8, 2009, provides an in-depth overview of our investment process, emphasizing economic analysis, compliance, social responsibility, and security analysis. Utilizing the Delphi Process, we rank industries and select top-performing securities via a robust top-down investment strategy. We cover portfolio optimization, management, and exit strategies, along with an analysis of 5 economic cycle phases. Guidelines for socially responsible investing and the financial health assessment of chosen securities are also discussed, ensuring a well-rounded investment approach that aligns with ethical standards.

Comprehensive Overview of the Investment Process: Analysis and Strategy Insights
E N D
Presentation Transcript
Investment Process Presentation December 8, 2009
Overview • Economic Analysis • Compliance, The Delphi Process • Social Responsibility • Security Analysis • Portfolio Optimization • Portfolio Management • Marketing, Exit Strategy • EAFE Inverse • Fund Performance
Our Funds • Haley Large Cap • Domestic • Coleman ETF • Domestic and International
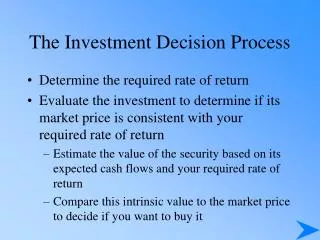
Top Down Investment Process • Economic Analysis • Compliance Screen • Social Responsibility Screen • Security Analysis • Portfolio Optimization
Anthony DeAngelis Economic analysis
Top Down Approach • Business Cycle Analysis • Industry picked off of current analysis • Sectors based off of selected industries • Best of breed individual securities selected • Continual monitoring to economic indicators in order to track ongoing economic cycle
Early Revival • The revitalization of business and consumer activity that follows a recessionary phase • GNP turns positive after falling sharply in the preceding recession • Businesses continue to clear unwanted inventory • Late Revival • GNP increases significantly • Growth puts upward pressure on credit demands and prices • Interest rates and inflation begin to rise (irregularly) • Housing activity picks up speed • Businesses build inventories and spend more on plant and equipment
Acceleration Stage • Consumers put off purchases, spend less • Interest rates and inflation begin to rise • Housing and auto sales decline • Businesses continue to build inventories and spend • Ease-off Stage • Business continue to remain optimistic • Economic indicators turn pessimistic • GNP turns negative • Inflation and interest rates may continue to rise • Housing and big-ticket item sales decline severely
Plunge • Businesses liquidate inventories • Employment drops sharply • Corporate profits plummet • Interest rates peak • Final Analysis: Early Revival • GNP – Turning positive • Improving employment picture
Selected Indicators • ISM Data • Fed Funds • Monetary Base • Manufacturing Work Week • GNP • Case Schiller • Money Supply • M1 • M2 • M3 (Shadow Statistics) • Employment Data • Initial Unemployment • Continuing Claims • Productivity Figures • Hours Worked
Resources • Bill Carter (Qinsight) Conference Call • Lacy Hunt • Jeremy Siegel weekly newsletter • St. Louis Fed • Bloomberg • Wall Street Journal • The Economist • Morningstar • Industry Specific News
Brendan Kearney The delphi process
Overview • Maintains objectivity • Increases accuracy of industry forecasts • Process • 2 rounds • Analysts conduct industry research and rank top 10 choices • Re-evaluation after 1st round results
Results • Round 1 • Started with 40 industries • Eliminated 8 • Round 2 • Analysts re-evaluated industries • Top 20 industries selected
George Coleman ETF • 50% International • 50% Domestic
Haley Group Large Cap • Market Cap: $5 billion and greater • Minimum average daily volume of 250,000 shares • Minimum share price of $10.00
Sumedha Verma Social responsibility
Socially Responsible Investing • As an Augustinian University, continue the rich tradition of Catholic Social Teaching and the guidance it provides • Avoid companies that ignore social responsibility • Recognize and incorporate companies that reflect Catholic stewardship • Lecture on social responsibility by Dr. Doh
Steps 1.) Evaluate the Catholic Bishop’s Statement 2.) Choose and rank our criteria based on past evaluations and our own additions 3.) Run IWFinancial for Social Responsibility rankings
IW Financial • Proprietary research and leading independent third party services • Specific data sources vary by product and data element • A company’s rating based on “Comparative Universe” • Ratings based on hard data
SRI Profile • High sensitivity on issues such as: • Bioethics • Environment • Life/Choice • Tobacco • Human Rights • Military • Adult Entertainment • Passing score: 66
Michael Feron Security analysis
Haley Large-Cap • Financial Health • DCF Valuation • Analyst Input and Recommendation
Financial Health • Altman Z-Score • Bankruptcy Risk • DuPont Ratios • ROE, ROA, Profit Margin, Asset Turnover, Equity Multiplier • Profitability • Balance Sheet Analysis • Current Ratio, Long Term Debt/Equity • Credit Rating
DCF Valuation • 10 Year Growth Projections • Future growth rates based on analyst research • Invested Capital-ROIC Calculations • WACC • Cost of Debt • Operating Lease Commitments
Analyst Input and Recommendation • Results of Financial Health Analysis • Altman Z Score & Credit Rating • Enterprise Value • Upside Return Potential • S&P Market Insight Reports • Other Independent Research
Coleman ETF Analysis • Domestic • Industries similar to Haley • S&P Market Insight • International • Economist Intelligence Unit (EIU) • Powershares, iShares, Vanguard and Morningstar
Vincent Fea Portfolio optimization
Portfolio Optimization • PMSP Software • Stein Estimators • Allocation constraints • Iterative scaling and re-optimizing process • Haley Fund – 48 35 stocks • Coleman Fund – 26 25 ETFs
Paul Iezzi Portfolio management
Process of Selecting a Security • Analyst does research • Analyst presents research to Investment Committee with a recommendation • Investment Committee votes on each security • A majority vote is required to invest • After optimization, the weights of each security are voted on
Orders • Example: Investment Committee votes a 5% allocation of IBM • Calculate number of shares • Current Price of $125 • Weight of 5% • Portfolio Value of $100,000 • 5% * $100,000 = $5,000 • $5,000 / $125 = 40 Shares
Orders Sheet Example Thursday, November 12, 2009 To: Dr. Nawrocki From: Paul Iezzi and Bob Goslin Re: Coleman ETF Orders
The Haley Group Large Cap Fund Invested on November 6, 2009 $102,482.82