Download
1 / 49
490 likes | 615 Vues
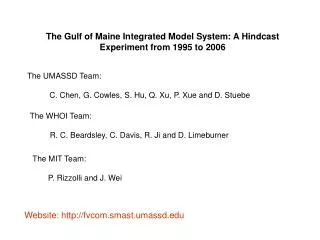
The Gulf of Maine Integrated Model System: A Hindcast Experiment from 1995 to 2006. The UMASSD Team: C. Chen, G. Cowles, S. Hu, Q. Xu, P. Xue and D. Stuebe. The WHOI Team: R. C. Beardsley, C. Davis, R. Ji and D. Limeburner. The MIT Team: P. Rizzolli and J. Wei.

E N D
The Gulf of Maine Integrated Model System: A Hindcast Experiment from 1995 to 2006 The UMASSD Team: C. Chen, G. Cowles, S. Hu, Q. Xu, P. Xue and D. Stuebe The WHOI Team: R. C. Beardsley, C. Davis, R. Ji and D. Limeburner The MIT Team: P. Rizzolli and J. Wei Website: http://fvcom.smast.umassd.edu
ETA (32 km) Hydrostatic Air stations Buoy data Satellite data Local network Nested Assimilation Regional domain MM5 (resolution: 30 km) Non-hydrostatic Local domain Nested Local domain MM5 (resolution: 10 km) SST (9 km) Local buoys Assimilation Wind stress, heat flux, air pressure, precipitation via evaporation The Gulf of Maine/Georges Bank MM5 Weather Hindcast/Forecast Model System Regional domain Sites of Surface Buoys Hindcast assimilation for years 1978-2006 On-line forecast system
Second Generation First Generation Horizontal Resolution: 0.5-1.0 km in the coastal region 31-sigma levels in the vertical Horizontal Resolution: 0.3-1.0 km in the coastal region 31-sigma levels in the vertical
256 Processors (Intel 3.4 GHz Pentium 4) 256 Gigabytes RAM, Infiniband High Speed Network 7 Terabytes disk space Third generation of GOM FVCOM Horizontal resolution: 10 -500 m in the coastal region Generalized terrain-following coordinates 46 layers: 10 uniform layers in the surface and bottom boundary layers, respectively
The Works Completed Since the Last Workshop Analysis of the 27 meteorological model results (H. Song with helps from C. Chen, R. C. Beardsley, G. Cowles); 2. Model-data comparison-GoMOOS, NS and New England Shelf (C. Chen, G. Cowles, D. Limeburner, R. C. Beardsley, Q. Xu and P. Xue); 3. Data assimilation experiments (OI and Ensemble Kalman Filters) (J. Wei, Q. Xu, P. Rizzoli, C. Chen, R. C. Beardsley); 4. Convert the GoM integrated model system to the Northeast Coastal Ocean Forecast System (NECOFS), with upgraded meteorological model (WRF) (G. Cowles, C. Chen, R. C. Beardsley)
Wind stress spectrum calculated from the 1978-2004 hourly wind fields 3-7 days Annual peak
: wind stress Ts: SST Ta: Air-temperature P: precipitation E: evaporation Qnet: net flux Qsw: short-wave Qsen: sensible Qlat: latent Qlw: long-wave
January-March Surface net heat flux Qnet (W/m2) 1998 Decade scale Surface wind stress
NAO index via normalized negative wind stress (Jan-March) NAO index via normalized heat flux (Jan-March)
1(9) 7(6) 14(8) 1980 strong wind year for GB, 1990 weak wind year for GB. (numbers in bracket is for year 1990)
2002 Buoy A: 2 m Buoy B: 2 m
2002 Buoy C: 2 m Buoy E: 2 m
FVCOM Model Validation: Comparison with CMO Observations Time Frame: Aug 1996 to Jun 1997 Location: New England Shelf, SW of Nantucket # Moorings: 4 (Central, Alongshore, Inshore, Offshore) Oceanic Variables: velocity, temp, conductivity, bottom pressure, bottom stress. Atmospheric Variables: wind stress, heat flux, buoyancy flux. Steve Lentz’s data Cowles and Lentz’s work
Temperature (Celsius) during CMO Period at Central Site August 1996 - June 1997 Observed FVCOM
Subtidal Surface Current During CMO: Observed (red) FVCOM (black) Along Isobath (Above, ~east) and Cross Isobath (Below, ~north)
N1/N2 Mooring Sites Comparison between observed and model-computed surface water temperatures and subtidal velocities at site N2 in Nantucket Sound. No assimilation is included. Mooring data from R. Limeburner.
OI Data Assimilation Experiments April 2002 May 2002 T: Temperature: red dots T/S: Temperature&salinity: blue dots June 2002
Without OI With OI Assimilation
Without OI With OI Assimilation
Without OI With OI Assimilation
GoMOOS Mooring Site B First generation GOM FVCOM GOMOOS station B
With EnKF Without EnKF Temperature field at day 1 after assimilation
With EnKF Without EnKF Velocity field at day 1 after assimilation
V (m/s) U (m/s) Time series of velocity at GoMOOS station B
BC’s North American Meso-scale (NAM) Weather Model Satellite SST Buoy Winds Insolation assimilation Local Weather Model (WRF) Heat Flux Wind Stress P-E U,V Form Drag BC’s Inflow GoM/GB FVCOM Surface Wave Model Global Tidal Model KEY U,V Waves, Langmuir Cells PAR Freshwater Input Satellite SST, U,V Buoy T,S,U,V Existing Models MASS Coastal FVCOM FVCOM System Groundwater Input Under developed assimilation Nutrients, Phytoplankton Ocean Colors BC’s Data Generalized Ecosystem Model (FVCOM Module) Sediment Transport Model (FVCOM Module) Larval data VPR Multi-Stage Zooplankton Model (IBM and concentration-based) Fish Larval Model (IBM and concentration-based) Northeast Coastal Ocean Forecast System (NECOFS)
MM5 10 km 30 km 3 km WRF 9 km
5-day forecast 5-day forecast 5-day forecast 3 day hindcast 3 day hindcast 3 day hindcast : The time starting for a 5 day forecast : The time ending for a 5 day forecast : The time zone for a 3 day hindcast with inclusion of the data asimilation : The time updating the initial condition for a 5 day forecast zone. ETA/WRF regional/coastal forecast SWAN/FVCOM regional forecast SWAN/FVCOM coastal forecast
MM5 WRF Time: 0:00 GMT April 17 2007
MM5 Surface Heat Flux WRF Surface Heat Flux Time: 0:00 GMT April 17 2007
3 km resolution results of WRF: Surface wind vectors and net heat flux 0:00 GMT April 17 2007
On-going Activities Conduct the data assimilation experiments with OI and K-Filters-partially have been completed for selected year experiments Validate the FVCOM-based unstructured grid surface wave model (SWAN-US). Improve the model dynamics with more accurate and complete river discharges