Download
1 / 29
290 likes | 464 Vues
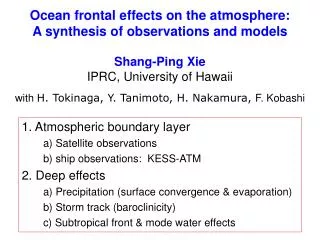
Ocean frontal effects on the atmosphere: A synthesis of observations and models Shang-Ping Xie IPRC, University of Hawaii with H. Tokinaga, Y. Tanimoto, H. Nakamura, F. Kobashi. 1. Atmospheric boundary layer a) Satellite observations b) ship observations: KESS-ATM 2. Deep effects

E N D
Ocean frontal effects on the atmosphere: A synthesis of observations and models Shang-Ping Xie IPRC, University of Hawaii with H. Tokinaga, Y. Tanimoto, H. Nakamura, F. Kobashi 1. Atmospheric boundary layer a) Satellite observations b) ship observations: KESS-ATM 2. Deep effects a) Precipitation (surface convergence & evaporation) b) Storm track (baroclinicity) c) Subtropical front & mode water effects
PositiveSST-Wind Correlation Negative SST-Wind Correlation SST Wind Mantua et al. (1997, BAMS) Nonaka & Xie (2003, JC)
Corr. (SST, wind speed) on short scales (<1,000 km): overwhelmingly positive, especially near SST fronts Small et al. (2008, DAO) Chelton et al. 2004, Science)
Mapping High Sea Winds from SpaceT. Sampe and S.-P. Xie (BAMS, 2007) High-wind occurrence varies by one order of magnitude over the open ocean between the warm and cold meanders of the Gulf Stream. Elevation (km) Frequency of QuikSCAT high winds (>20 m/s; color = % of time) and SST (°C; contours)during winter months (DJF).
Tokigana et al., 2006: Atmospheric sounding over the winter Kuroshio Extension: Effect of surface stability on atmospheric boundary layer structure. Geophys. Res. Lett. Sounding sites & TMI SST Ship-board atmos soundings θv Wind speed unstable Composite profiles, based on near-surface atmospheric stability (Ta–Ts) stable stable unstable
Meiyu/Baiu Front T & q @ 925 hPa June SST & Precip Kuroshio Extension System Study (KESS) Summer cruises
NCAR GPS Sounding Ceilometer on R/V Melville SST 2005: well-defined SST front along KE. 2006: A warm tongue from Japan, with weak SST gradients on KESS tracks. SST & wind 6/1-7/5/2006 6/17 – 7/17/2005
q, RH Southerly Northerly Cold advection across the ocean front Elevated cloud base that varies across the front. Warm advection across the SST front Fog formation with a stable surface layer north of the front. Tanimoto et al., 2009: Observations of marine atmospheric boundary layer transitions across the summer Kuroshio Extension. J. Climate, in press.
Northerly cold advection • Unstable ABL Stratocumulus • Enhanced turbulent heat flux N Ta Xie (2004, BAMS) SST Summer ABL Transition & Effect on Baiu (Tanimoto et al. 2009) • Southerly warm advection • Stable ABL Fog • Zero latent heat flux negative FB for Baiu? SST S N Ta
Deep atmospheric effects 1.Convergence 2.Evaporation: large (Ts-Ta) & strong wind 3. Baroclinicity U Ta SST Gulf Stream studies: Minobe’s talk & Yoshida’s poster
Deep atmospheric effects of the Kuroshio Extension: Winter Tokinaga et al. (2009, JC) Cloud Liquid Water & SST Turbulent heat flux Surface wind convergence
V’T’ (850 hPa) Baroclinicity effect U (925 hPa) Aqua-plant AGCM Nakamura et al. (2008, GRL) Latitude Southern Ocean observation (Nakamura and Shimpo 2004, JC)
Baroclinicity effect SST _ + H L Inatsu et al. (2003, JC) Southern Ocean AGCM experiments (Inatsu and Hoskins 2005, JC)
cm/s Subtropical countercurrent (STCC) is an eastward current in the south subtropical gyre, where the Sverdrup theory predicts westward flow. Kobashi et al., 2006: Three subtropical fronts in the North Pacific: Observational evidence for mode water-induced subsurface frontogensis. J. Geophys. Res.-Oceans, 111, C09033, doi: 10.1029/2006JC003479
Formation of Subtropical Countercurrent (STCC): Role of mode waters Potential vorticity (color), streamline (white) & STCC (dotted) STCC Kobashi et al. (2006, JGR)
Weekly TMI SST 30 April-6 May 2000 Revisit wind with QuikSCAT Wind & curl May • The subtropical countercurrent (STCC) anchors in May: • Minimum in NE trade winds; • Island of weakly positive curls in a sea of negative curls; • Local maximum in column-integrated water vapor a deep moist layer. Vapor path & SST May
May 2001 Anomalies of (v, w) & humidity when curl is positive Kobashi, F., S.-P. Xie, N. Iwasaka and T. Sakamoto, 2008: Deep atmospheric response to the North Pacific oceanic subtropical front in spring. J. Climate, 21, 5960–5975 .
SLP & wind curl composites H H H L L H H H L L L
Atmospheric effects of STCC in CCSM3 simulations Net heat flux (color), SST (gray) & geo currents: Annual mean The southwest slanted band of countercurrent is characteristic of mode-water ventilation and the resultant eastward current formation. • STCC • Northward warm advection • Net flux out of the ocean • Enhanced precip • Reduced the downward Ekman pumping • Enhanced northward Sverdrup current Precip (gray + white contours), Ekman pumping & surface wind
SSH mean& A1B anomalies (color) (CI=10, 1 cm) A1B Climate change in CCSM3 (2057-2010) STCC weakens in global warming, possible as a result of weakened mode water formation over KOE (shallower mixed layer due to surface warming, and weakened eastward flow). 0 SST mean& A1B anomalies (color), geo current anomalies The change in mode water ventilation induces surface geostrophic currents, leaving significant imprints in SST warming. SST, rain (shade) & wind anomalies SST bands induce precipitation and Ekman pumping response
Summary • Satellite observations (e.g., QuikSCAT): ubiquitous influence of SST fronts on surface winds • KESS: Intensified cross-frontal advection causes atmospheric boundary layer transition, e.g. in cloud. • Evidence is emerging for deep atmospheric effects in the mean state: surface convergence, evaporation, and baroclinicity (Gulf Stream, Kuroshio Extension, Subtropical front, mode water ventilation). • Unclear are deep, large-scale effects of ocean frontal variability on instrumental records.
Summary • Deep atmospheric response is found along the fronts of the Gulf Stream and North Pacific subtropical countercurrent (STCC). • The Gulf Stream front anchors surface wind convergence and intensifies surface evaporation on the warm flank, both effects enhancing convective rainfall. • The North Pacific STCC front maintains a band of weakly positive wind curls by anchoring a zone of enhanced baroclinicity, along which cyclonic disturbances grow.
North Pacific & Atlantic • poleward heat transport (contour), SST gradient (color) • westerly wind speed (shading: upper, contour: lower)
Satellite studies of atmospheric effects of ocean fronts (2) H. Tokinaga (IPRC), Y. Tanimoto (Hokkaido U), S.-P. Xie, T. Sampe (IPRC), H. Tomita, and H. Ichikawa (JAMSTEC) In winter, the Kuroshio Extension anchors a convergence zone, raises the cloud top, and intensifies lightning. AIRS cloud top occurrence QuikSCAT wind convergence AIRS cloud top occurrence SST gradient (contour)
Kuroshio Extension effect: Summer AIRS cloud top occurrence > 20% in 500-300 hPa In summer, the Kuroshio Extension anchors a convergence zone, and the eastward extension of the deep Baiu rain band (Tokinaga et al., 2009 J Climate).
TRMM QuikSCAT Evaporation J-OFURO2 Surface current speed
Colored contour: wind convergence. Black contour: boundary layer height. Minobe, S., A. Kuwano-Yoshida, N. Komori, S.-P. Xie, and R.J. Small, 2008: Influence of the Gulf Stream on the troposphere. Nature, 452, 206-209.
Gulf Stream-induced upward motion penetrates into the upper troposphere, forcing planetary waves that propagate along the westerly jet stream. Minobe, S., A. Kuwano-Yoshida, N. Komori, S.-P. Xie, and R.J. Small, 2008: Influence of the Gulf Stream on the troposphere. Nature, 452, 206-209. Upper tropospheric response to Gulf-Stream heating: Geopotential height at 250 hPa
Ts – Ta & wind Annual-mean iCOADS